We’ll demonstrate a local open-source workflow, viewing results as a pandas dataframe and a visual report — ideal for Jupyter or Colab. At the end, we also show how to upload results to the Evidently Platform. If you are in a non-interactive Python environment, choose this option.
- Retrieval. Assessing the quality of retrieved contexts, including per-chunk relevance.
- Generation. Evaluating the quality of the final response, both with and without ground truth.
Run a sample notebook: Jupyter notebook or open it in Colab.
To simplify things, we won’t create an actual RAG app, but will simulate getting scored outputs. If you want to see an example where we also create a RAG system, check this video tutorial.
1. Installation and Imports
Install Evidently:2. Evaluating Retrieval
Single Context
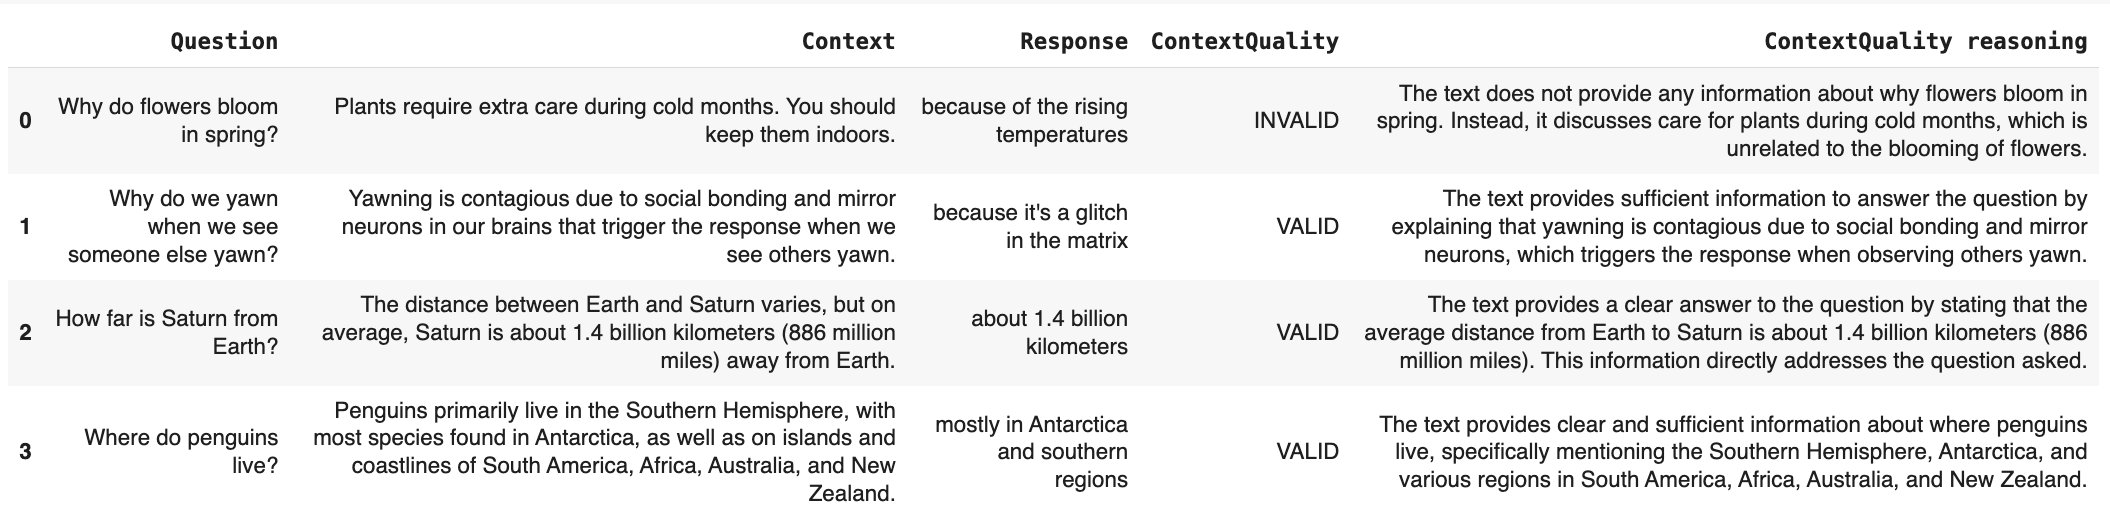
First, let’s test retrieval quality when a single context is retrieved for each query. Generate a synthetic dataset. We create a simple dataset with questions, retrieved contexts, and generated responses.- We create an Evidently dataset object.
- Simultaneously, we add descriptors: evaluators that score each row.
-
We use a built-in LLM judge metric
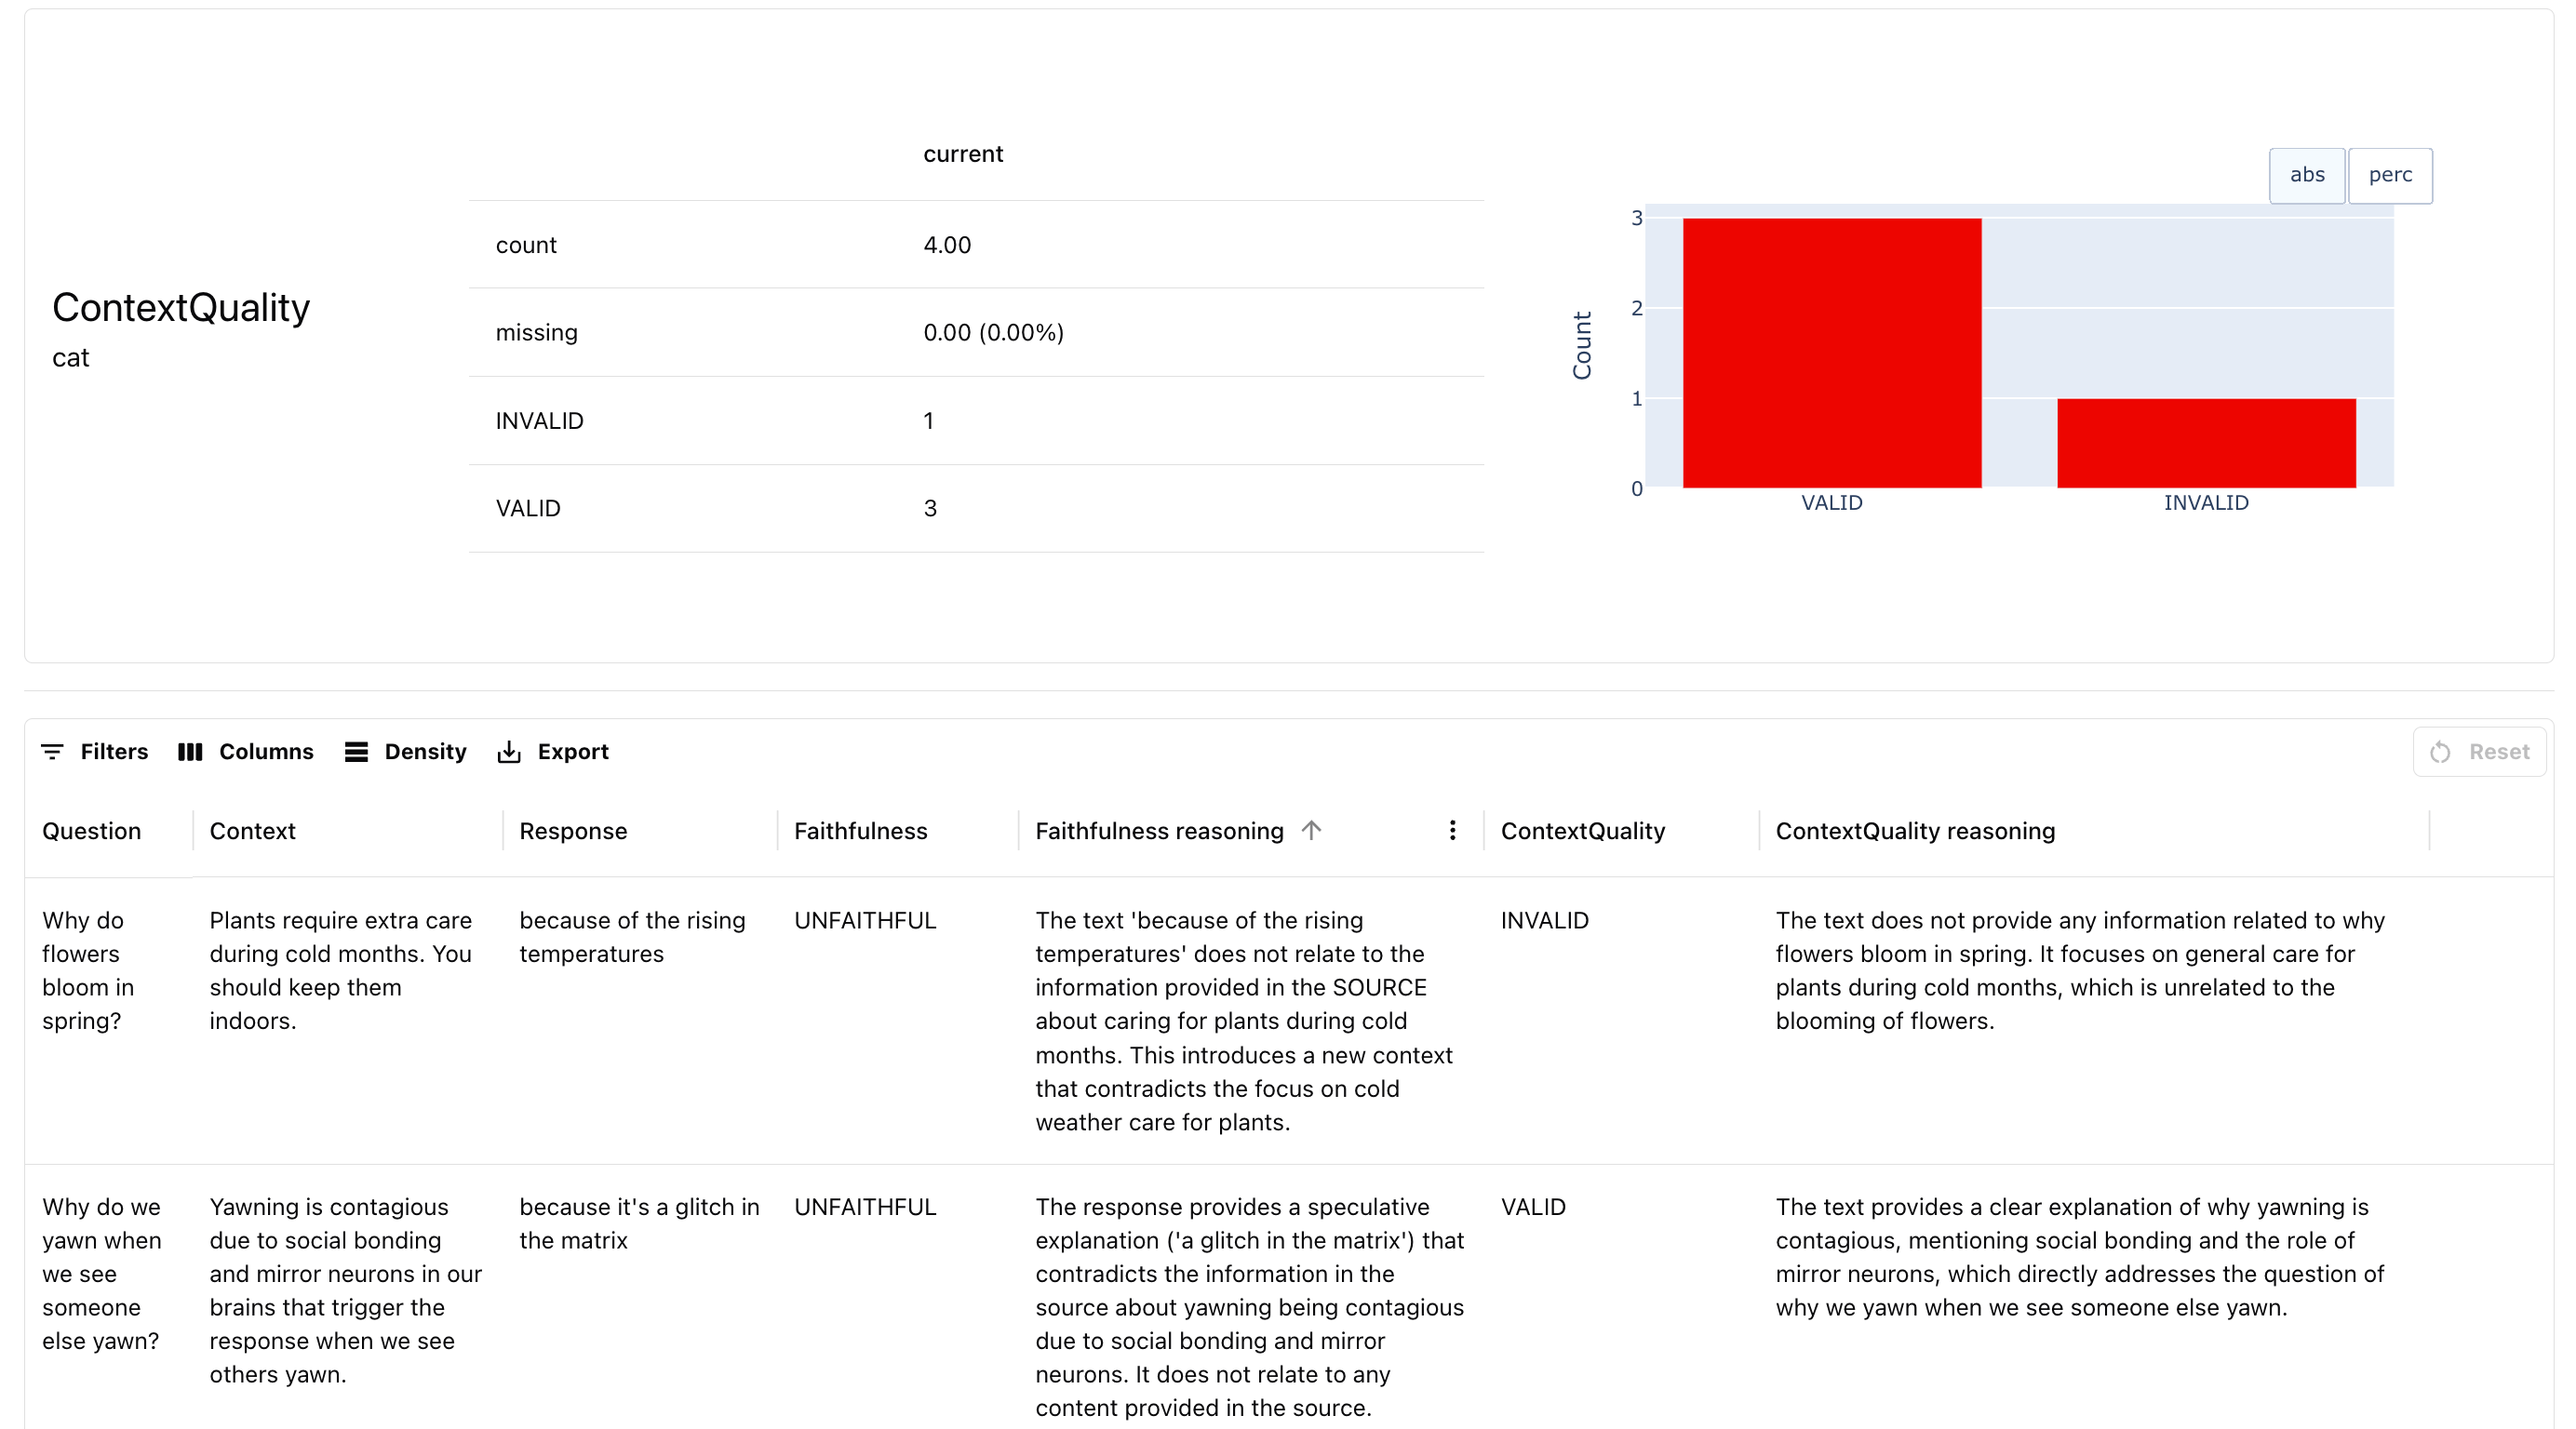
ContextQualityLLMEval.
You can also choose a different evaluator LLM or modify the prompt. See LLM judge parameters.
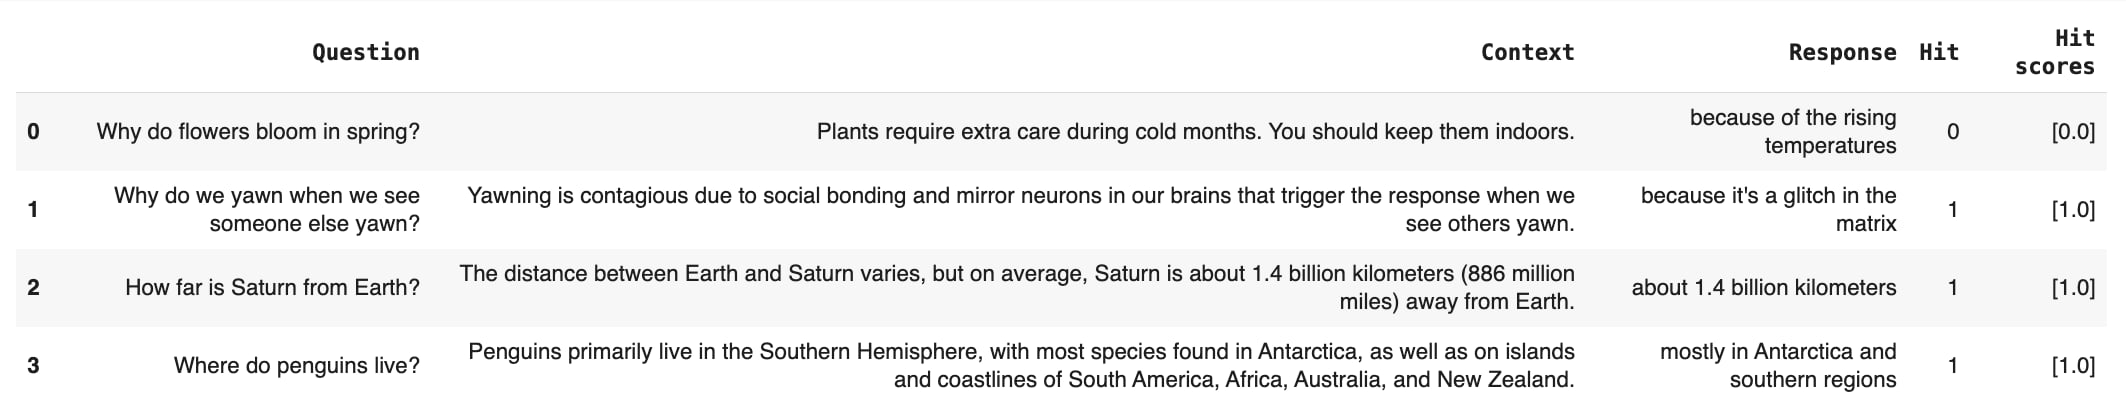
ContextRelevance metric.
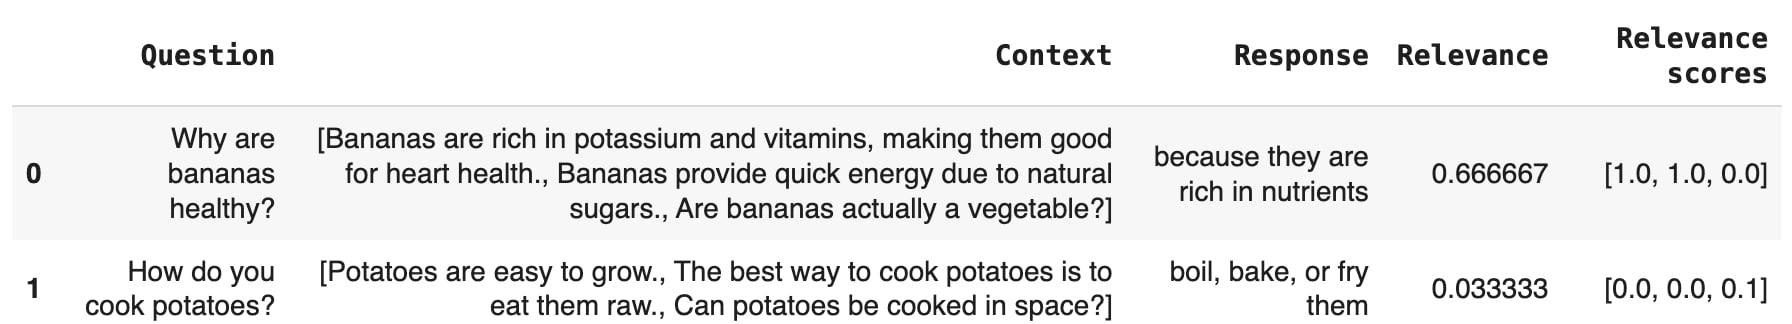
Multiple Contexts
RAG systems often retrieve multiple chunks. In this case, we can assess the relevance of each individual chunk first. Let’s generate a toy dataset. Pass all contexts as a list.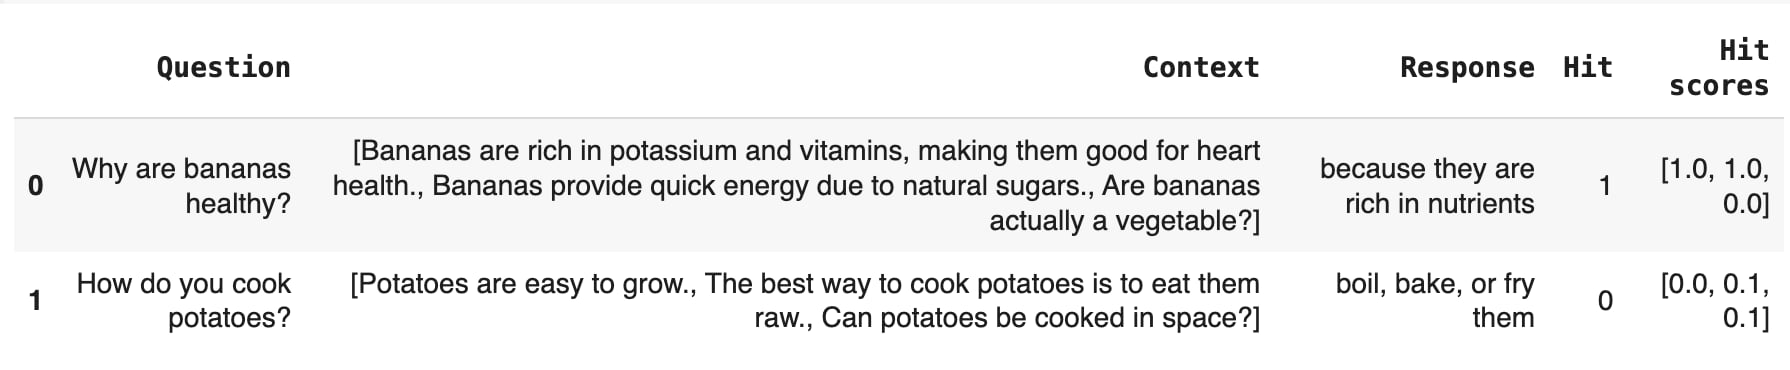
3. Evaluating Generation
With Ground Truth
If you a have ground truth dataset for RAG, you can compare the generated responses against known correct answers.Synthetic data. You can generate a ground truth dataset for your RAG using Evidently Platform.
CorrectnessLLMEval) and non-LLM methods like Semantic similarity and BERTScore. Let’s run all three at once, but we’d recommend choosing the one:
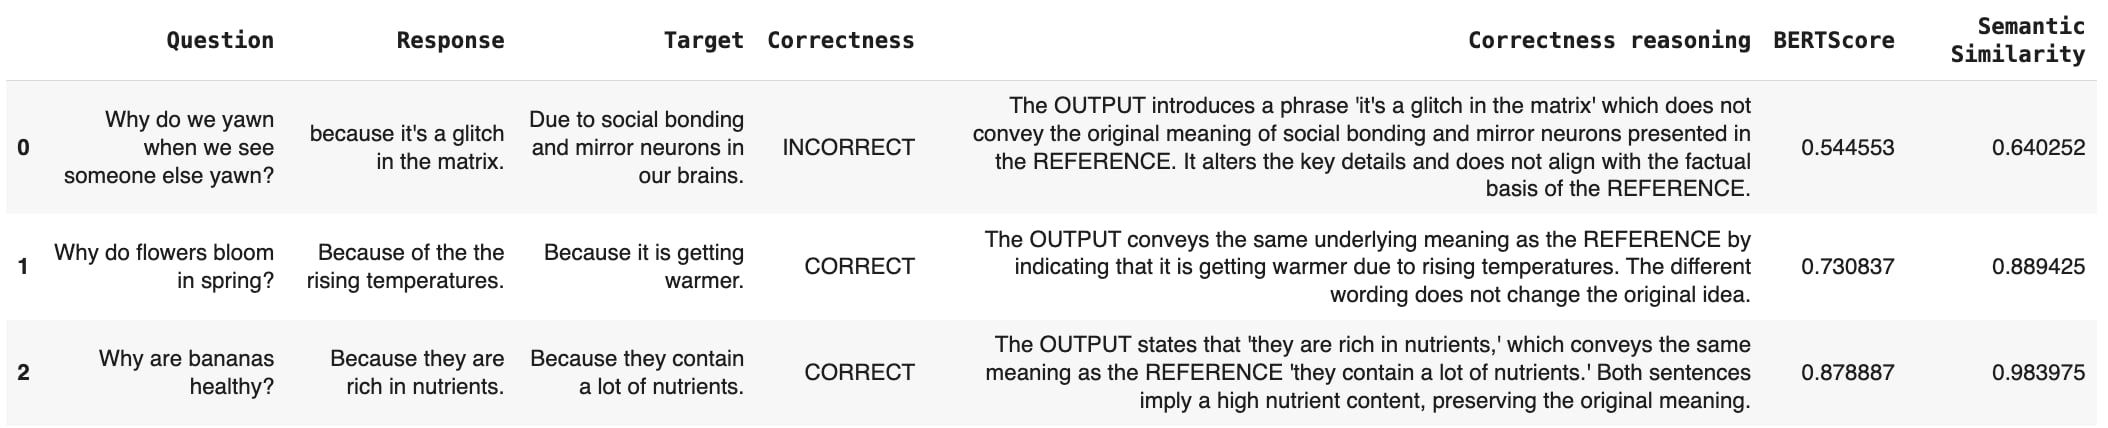
Editing the LLM prompt. You can tweak the definition of correctness to your own liking. Here is an example tutorial on how we tune a correctness descriptor prompt.
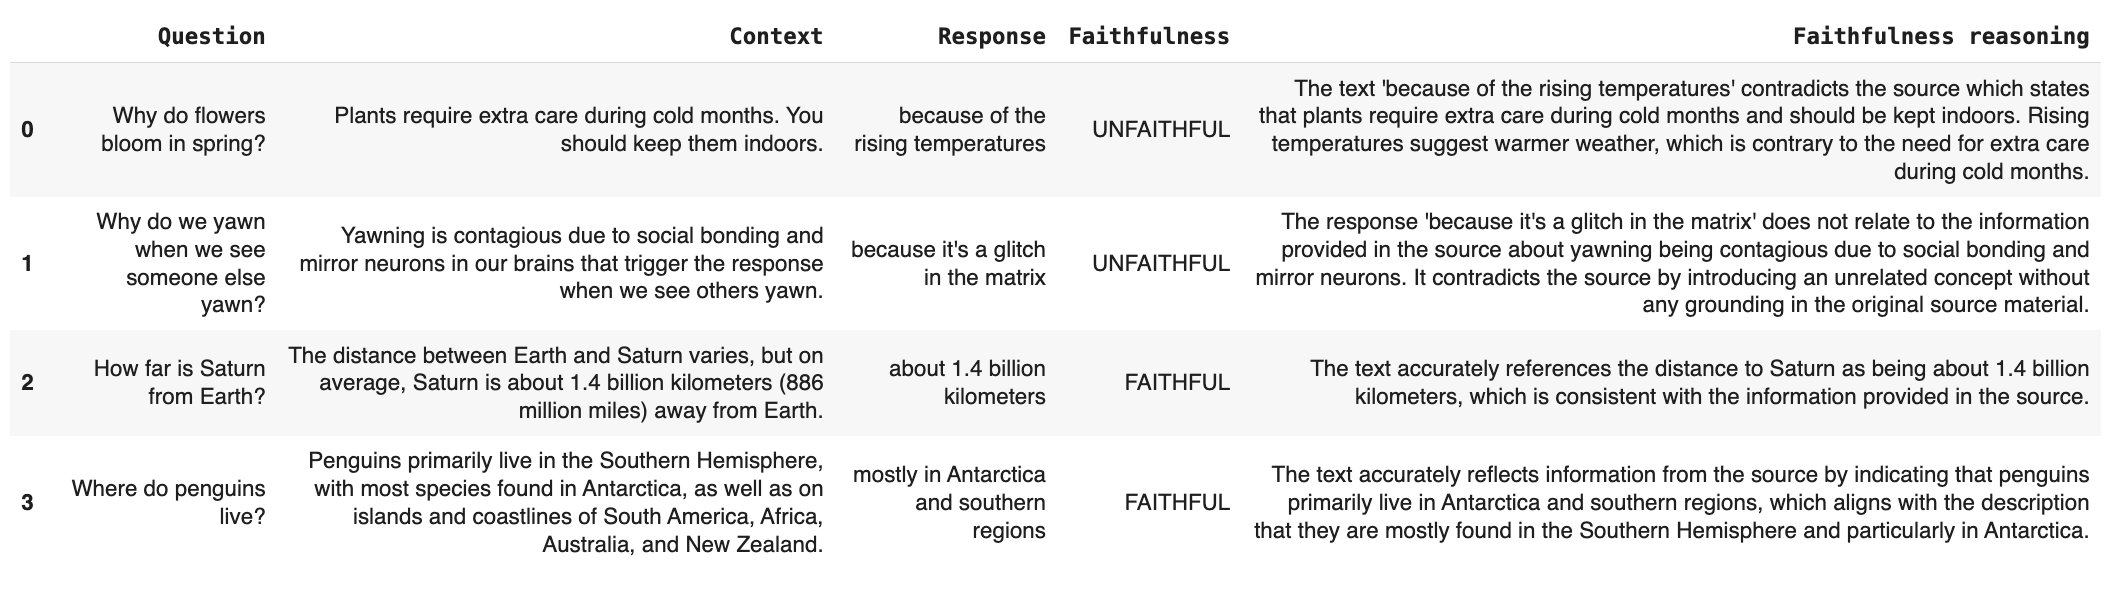
Without Ground Truth
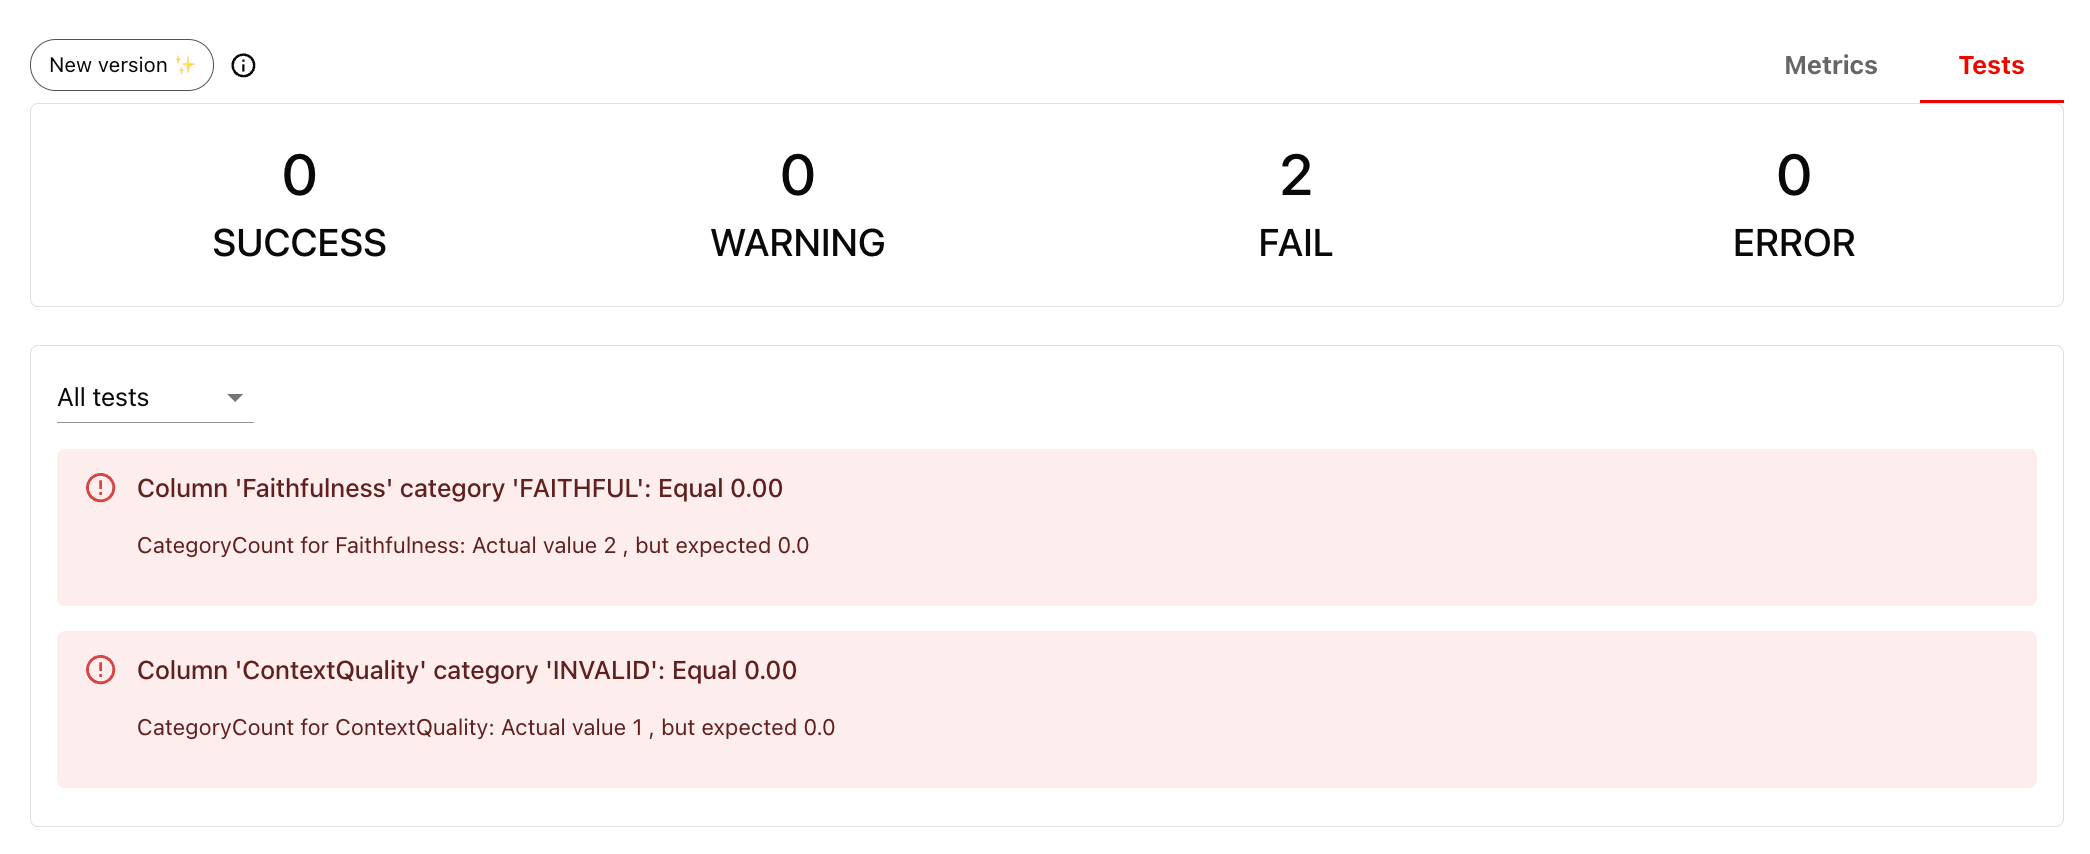
If you don’t have reference answers, you can use reference-free LLM judges to assess response quality. For example, here is you how can run evaluation forFaithfulness to detect if the response is contradictory or unfaithful to the context:
- Length constraints: are responses within expected limits?
- Refusal rate: monitoring how often the system declines questions.
- String matching: checking for required wording (e.g., disclaimers).
- Response tone: ensuring responses match the intended style.
Available evaluators. Check a full list of available descriptors.
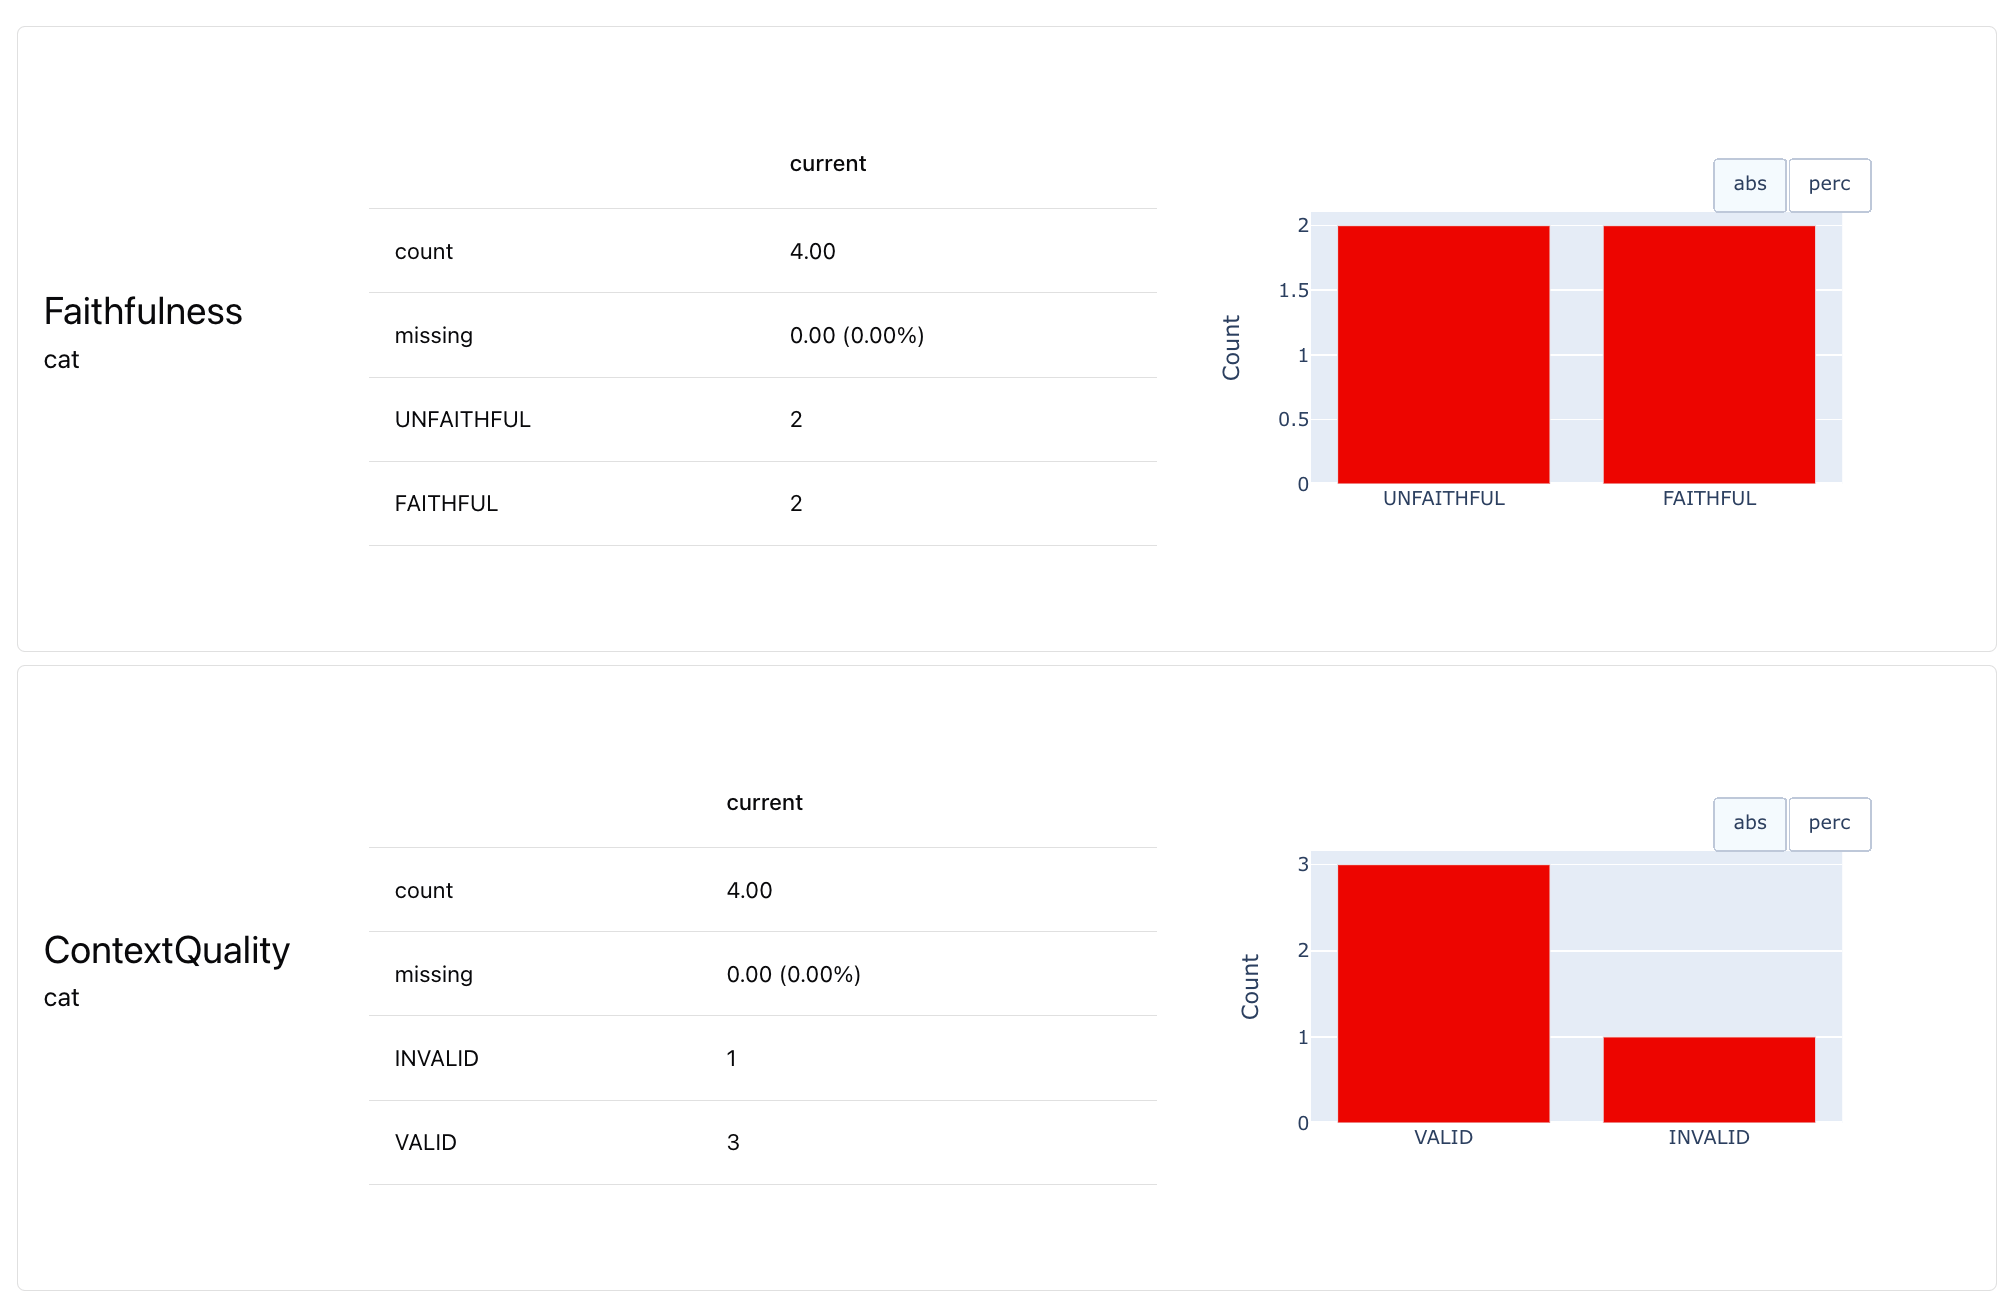
4. Get Reports
Once you have defined what you are evaluating, you can group all your evals in a Report to summarize the results across multiple tested inputs. Let’s put it all together. Score data. Once you have a pandas dataframesynthetic_df, you create an Evidently dataset object and choose the selected descriptors by simply listing them.
as_dict() for a Python dictionary output.
5. Upload to Evidently Cloud
To be able to easily run and compare evals, systematically track the results, and interact with your evaluation dataset, you can use the Evidently Cloud platform.Set up Evidently Cloud
- Sign up for a free Evidently Cloud account.
- Create an Organization if you log in for the first time. Get an ID of your organization. (Link).
- Get an API token. Click the Key icon in the left menu. Generate and save the token. (Link).
Create a Project
Connect to Evidently Cloud using your API token:Send your eval
Since you already created the eval, you can simply upload it to the Evidently Cloud.