This example uses Evidently Cloud. You’ll run evals in Python and upload them. You can also skip the upload and view Reports locally. For self-hosted, replace
CloudWorkspace with Workspace.Tutorial scope
Here’s what we’ll do:- Create a toy dataset. Build a small Q&A dataset with answers and reference responses.
- Get new answers. Imitate generating new answers to the same question.
- Create and run a Report with Tests. Compare the answers using LLM-as-a-judge to evaluate length, correctness and style consistency.
- Build a monitoring Dashboard. Get plots to track the results of Tests over time.
To simplify things, we won’t create an actual LLM app, but will simulate generating new outputs.
- Basic Python knowledge.
- An OpenAI API key to use for the LLM evaluator.
- An Evidently Cloud account to track test results. If not yet, sign up for a free account.
You can see all the code in Jupyter notebook or click to open in Colab.
1. Installation and Imports
Install Evidently:2. Create a Project
Connect to Evidently Cloud. Replace with your actual token:3. Prepare the Dataset
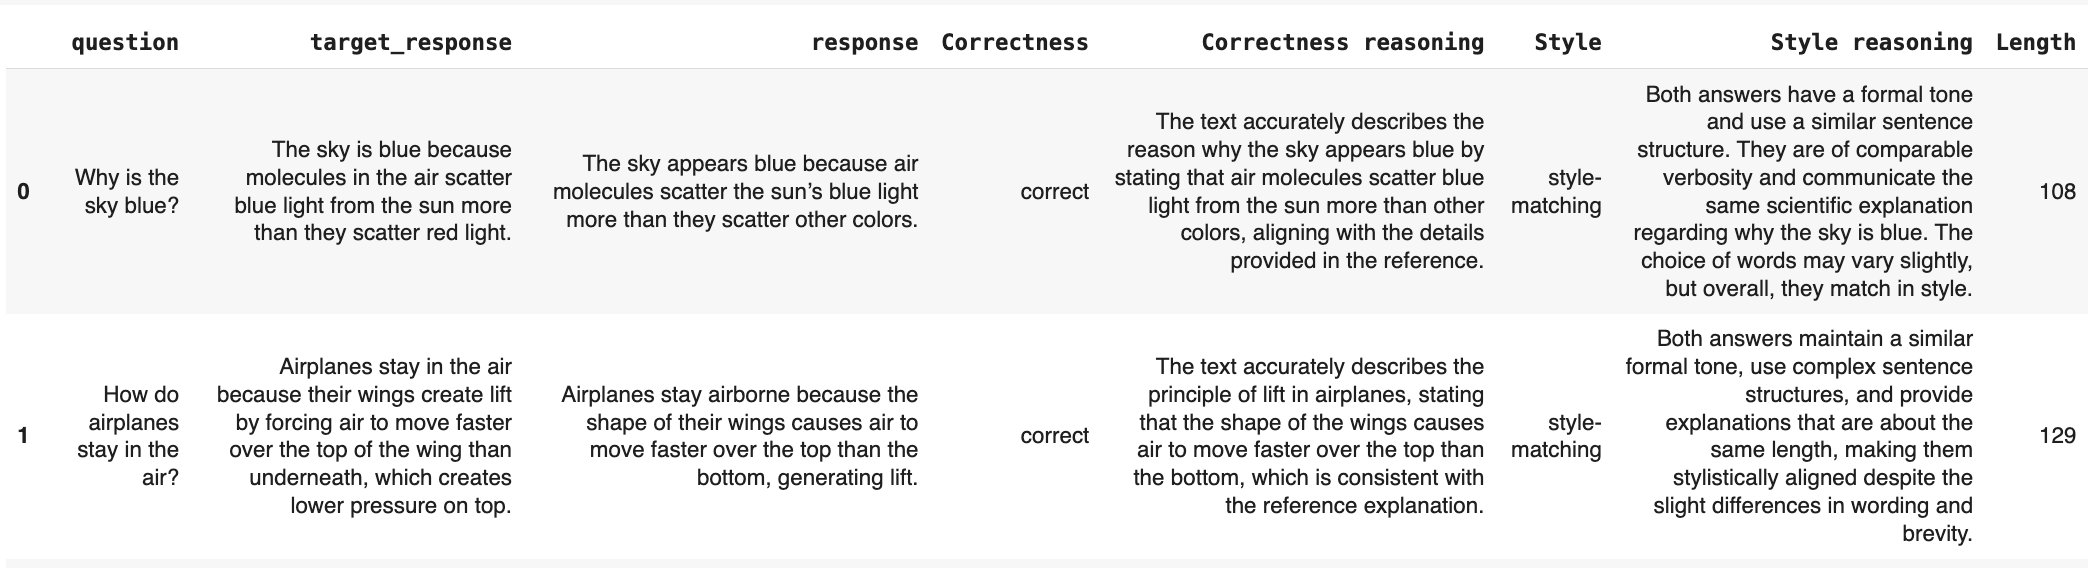
Create a toy dataset with questions and reference answers.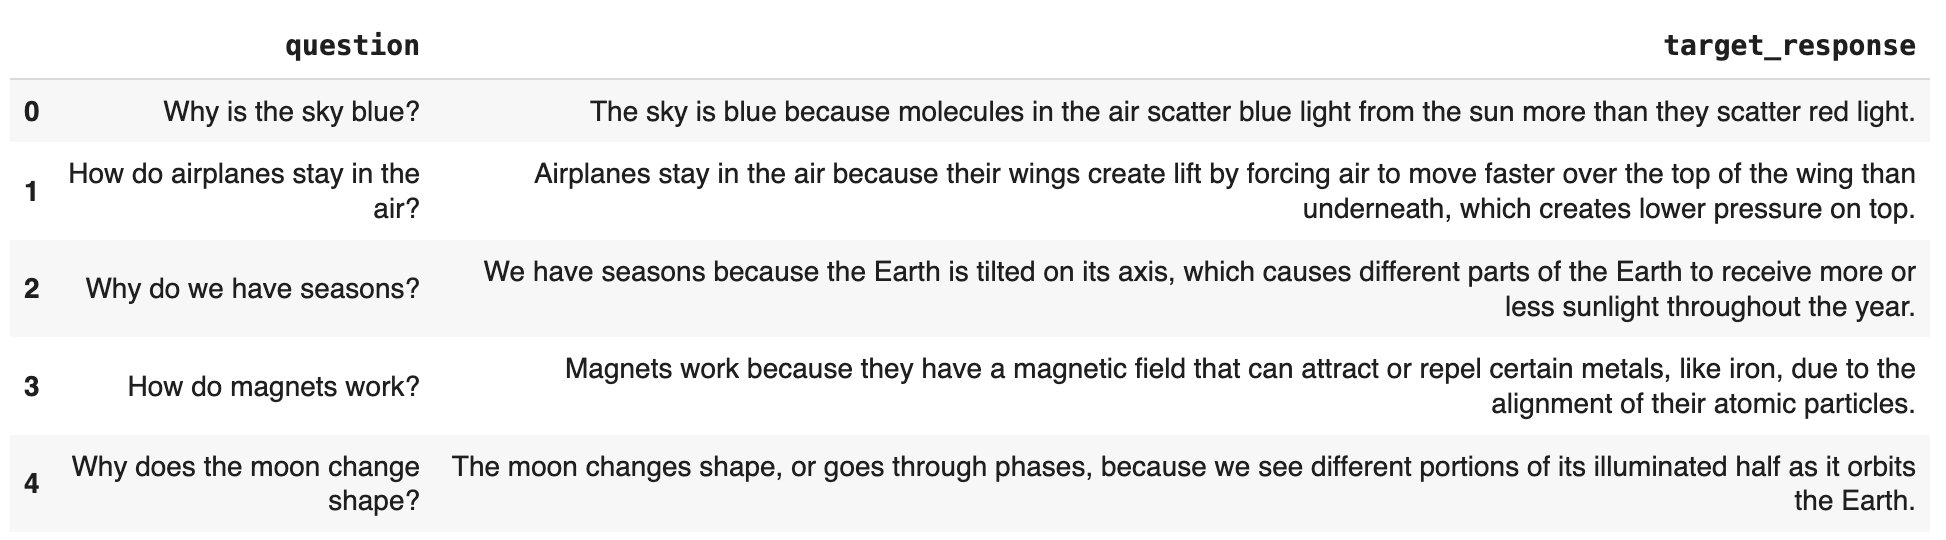
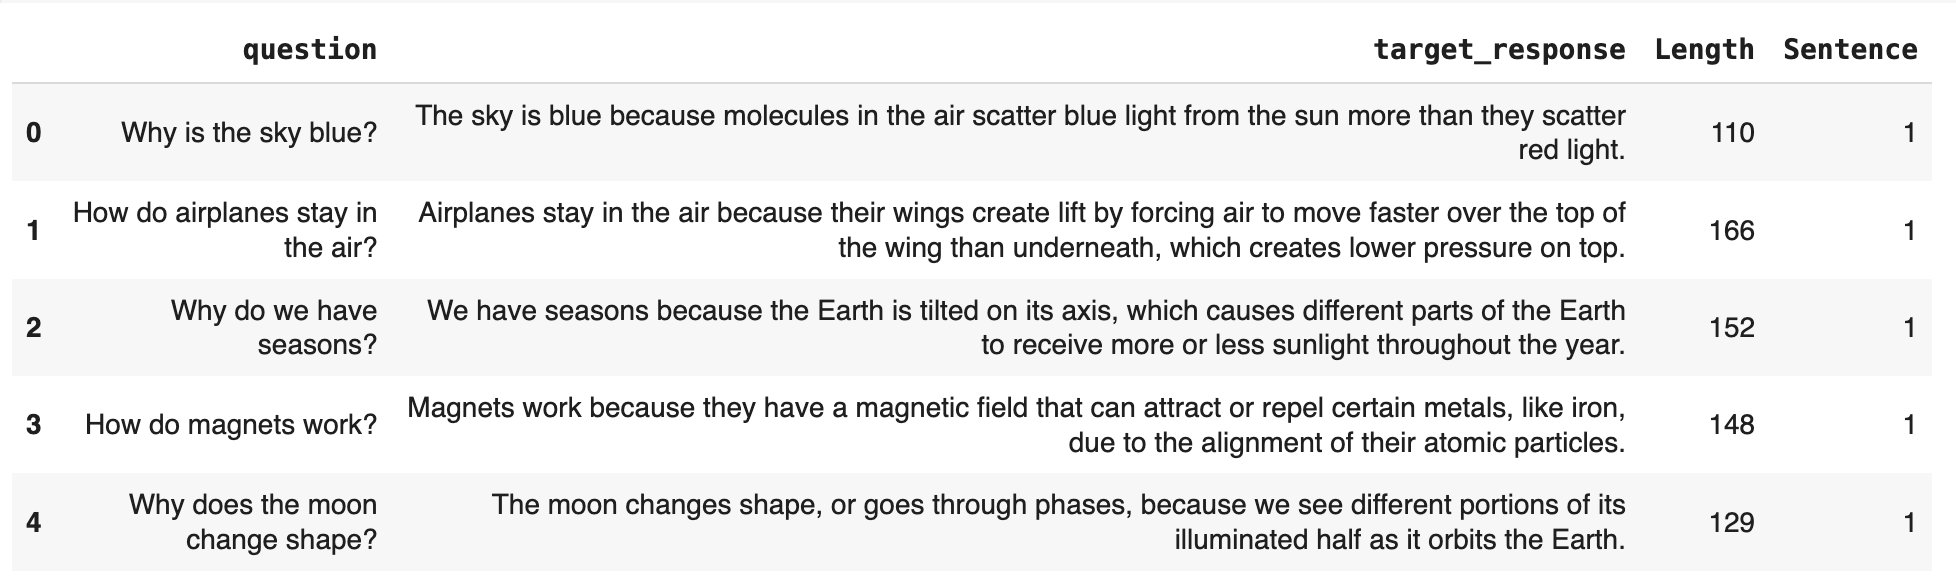
- Created an Evidently Dataset object with automatic data definition.
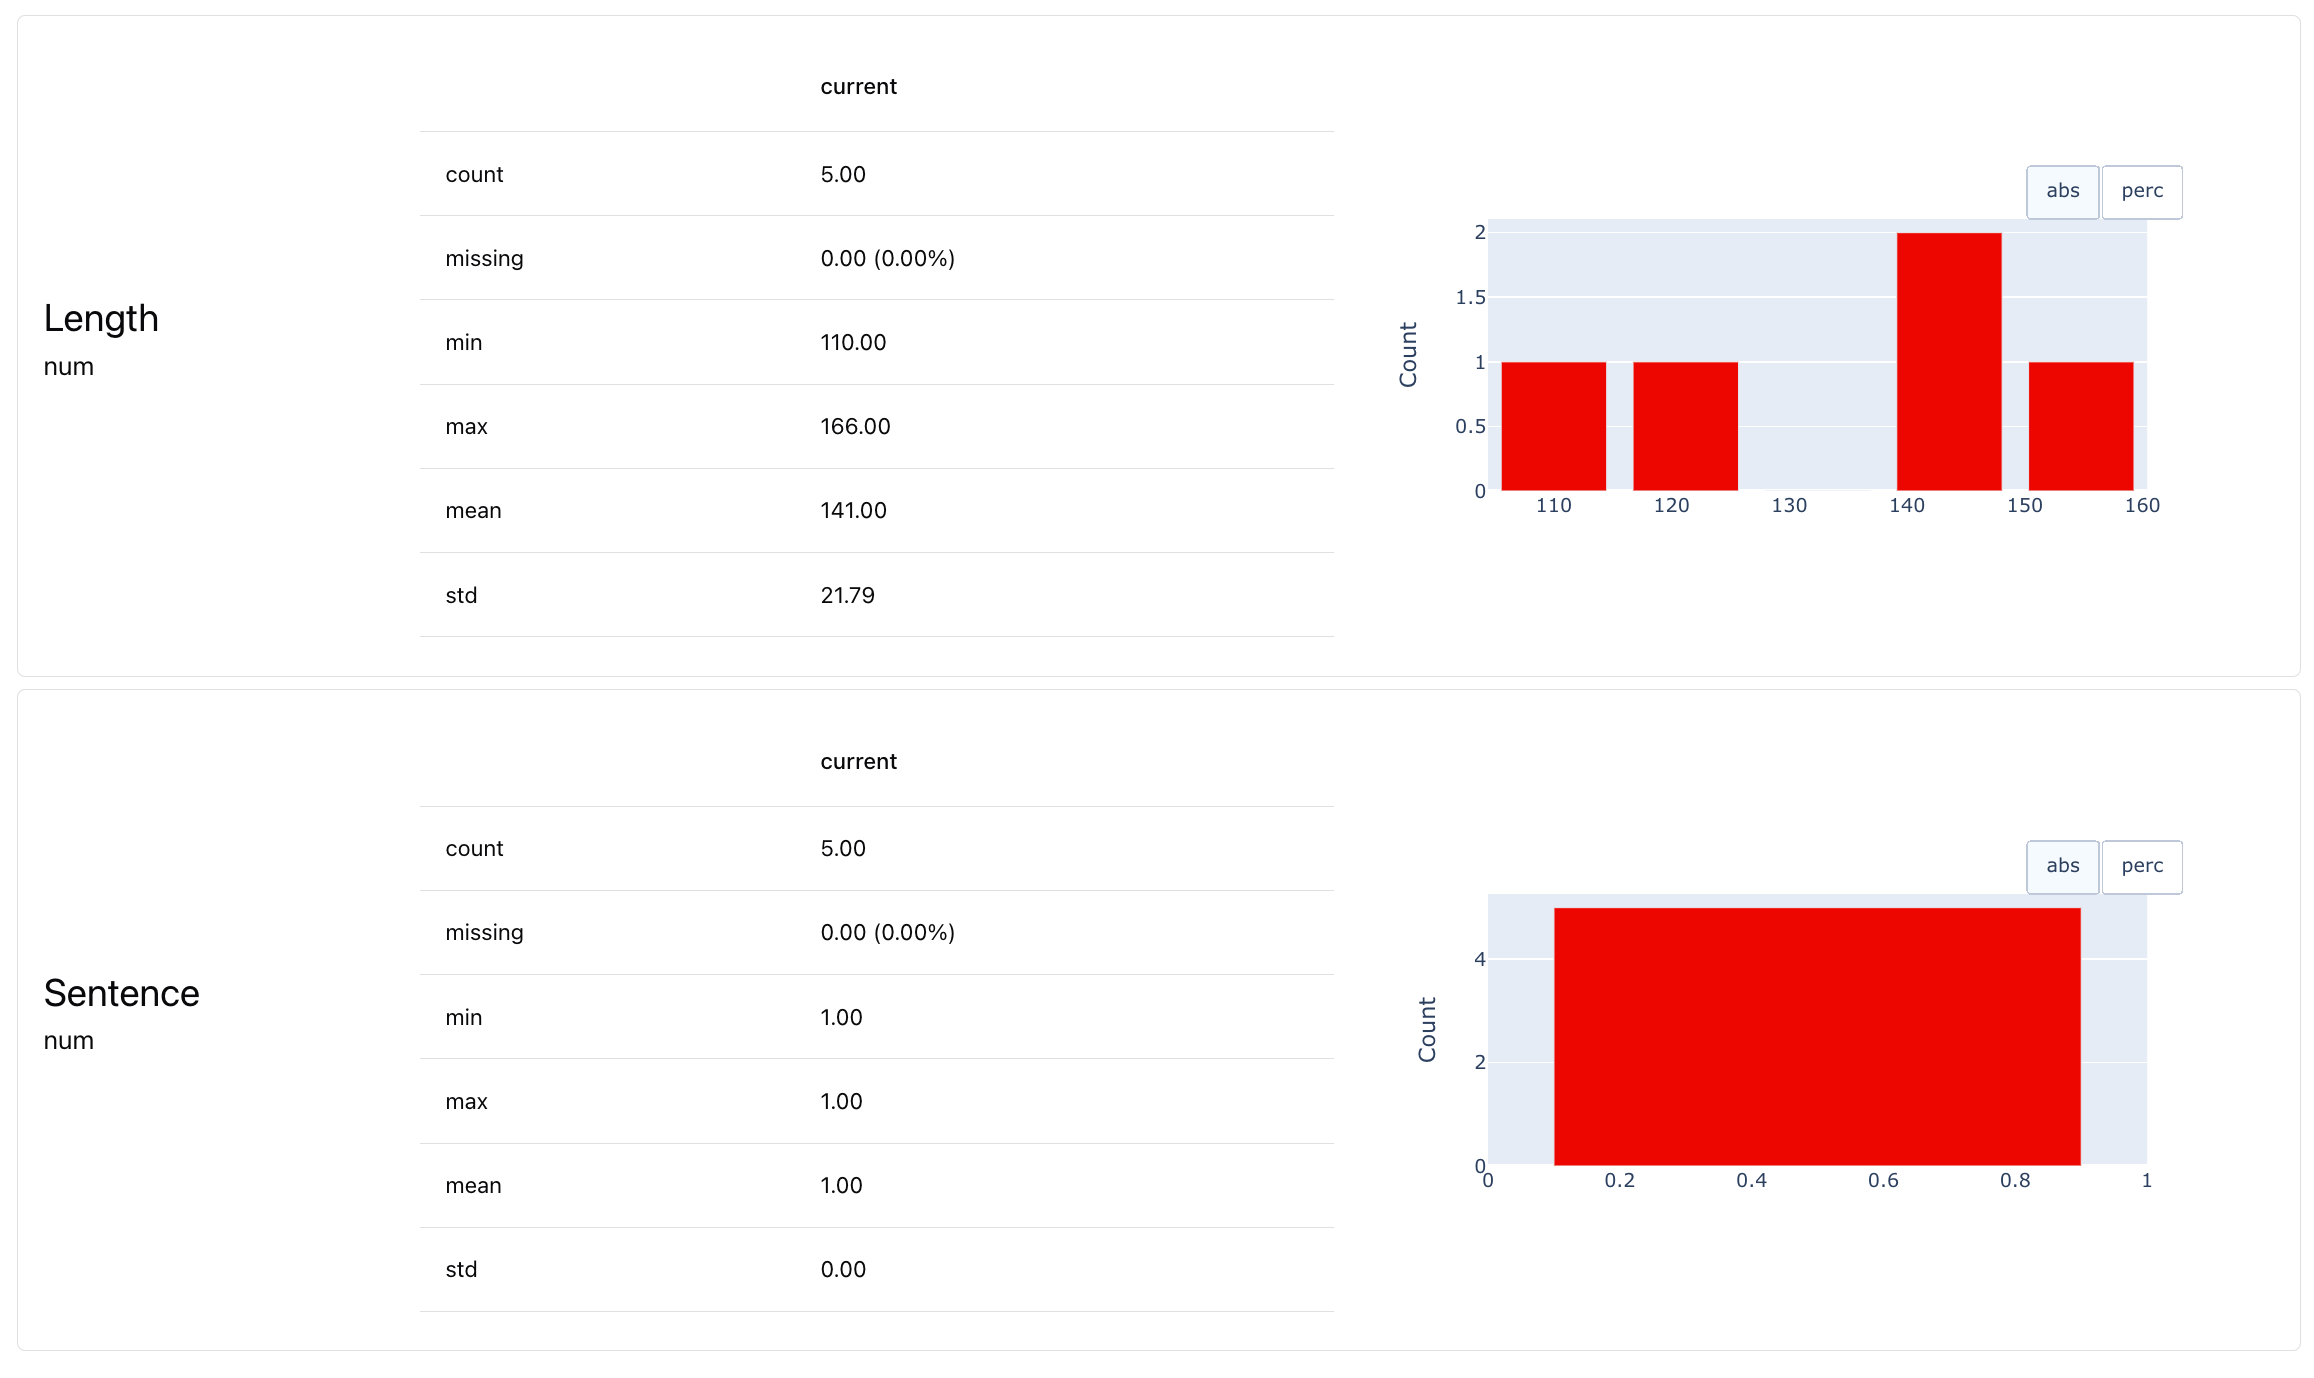
- Added two built-in descriptors on text length and symbol count. (See others).
- Exported results as a dataframe.
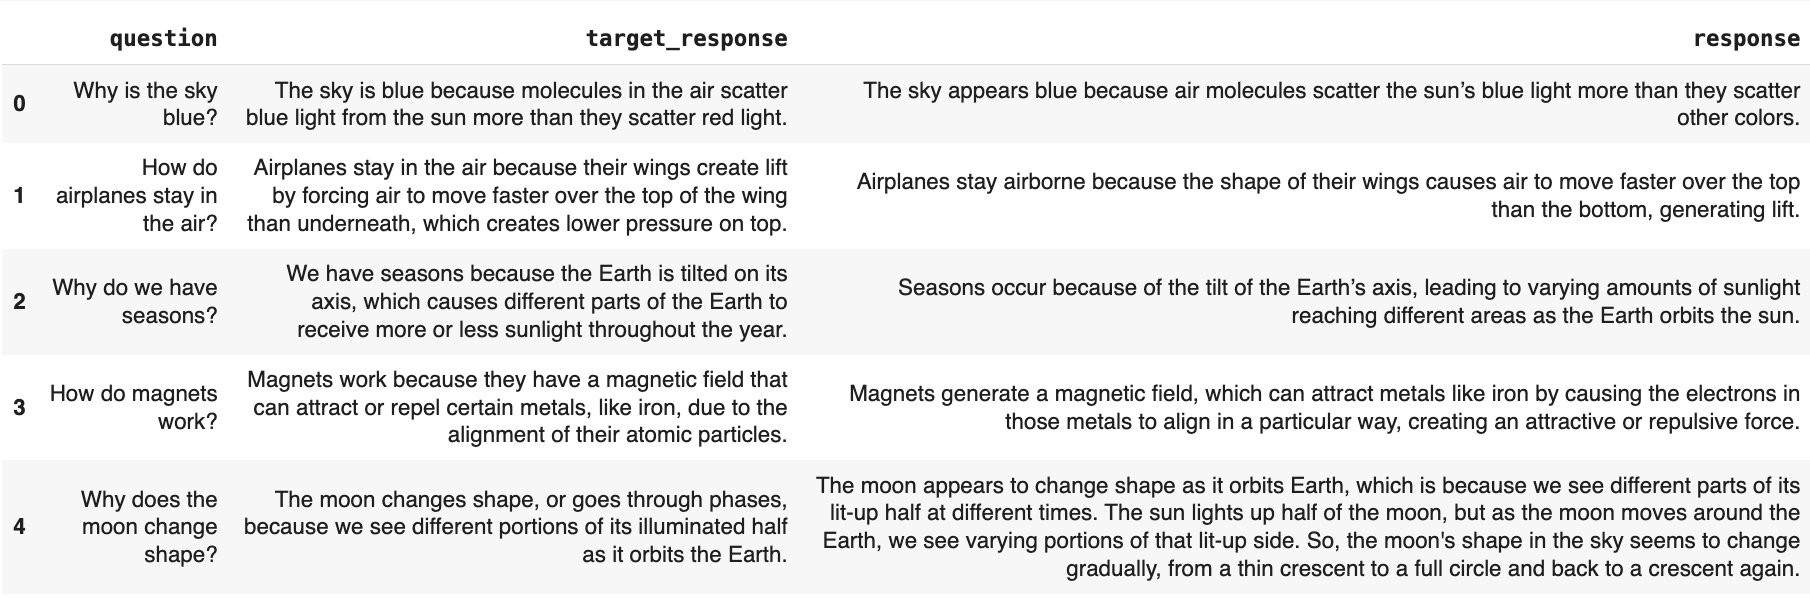
4. Get new answers
Suppose you generate new responses using your LLM after changing a prompt. We will imitate it by adding a new column with new responses to the DataFrame:New toy data generation
New toy data generation
Run this code to generate a new dataset.
How to connect it with your app? Replace this step with calling your LLM app to score the inputs and add the new responses to the DataFrame. You can also use our
tracely library to instrument your app and get traces as a tabular dataset. Check the tutorial with tracing workflow.5. Design the Test suite
To compare new answers with old ones, we need evaluation metrics. You can use deterministic or embeddings-based metrics like Semantic Similarity. However, you often need more custom criteria. Using LLM-as-a-judge is useful for this, letting you define what to detect. Let’s formulate what we want to Tests:- Length check. All new responses must be no longer than 200 symbols.
- Correctness. All new responses should not contradict the reference answer.
- Style. All new responses should match the style of the reference.
Correctness judge
We implement the correctness evaluator, using an Evidenty template for binary classification. We ask the LLM to classify each response as “correct” or “incorrect” based on thetarget_response column and provide reasoning for its decision.
You can also use a built-in
CorrectnessLLMEval() to use a default prompt.Ideally, evaluate your judge first! Each LLM evaluator is a small ML system you should align with your preferences. We recommend running a couple of iterations. Check the tutorial on LLM judges.
Template parameters. For an explanation of each parameter, check the LLM judge docs.
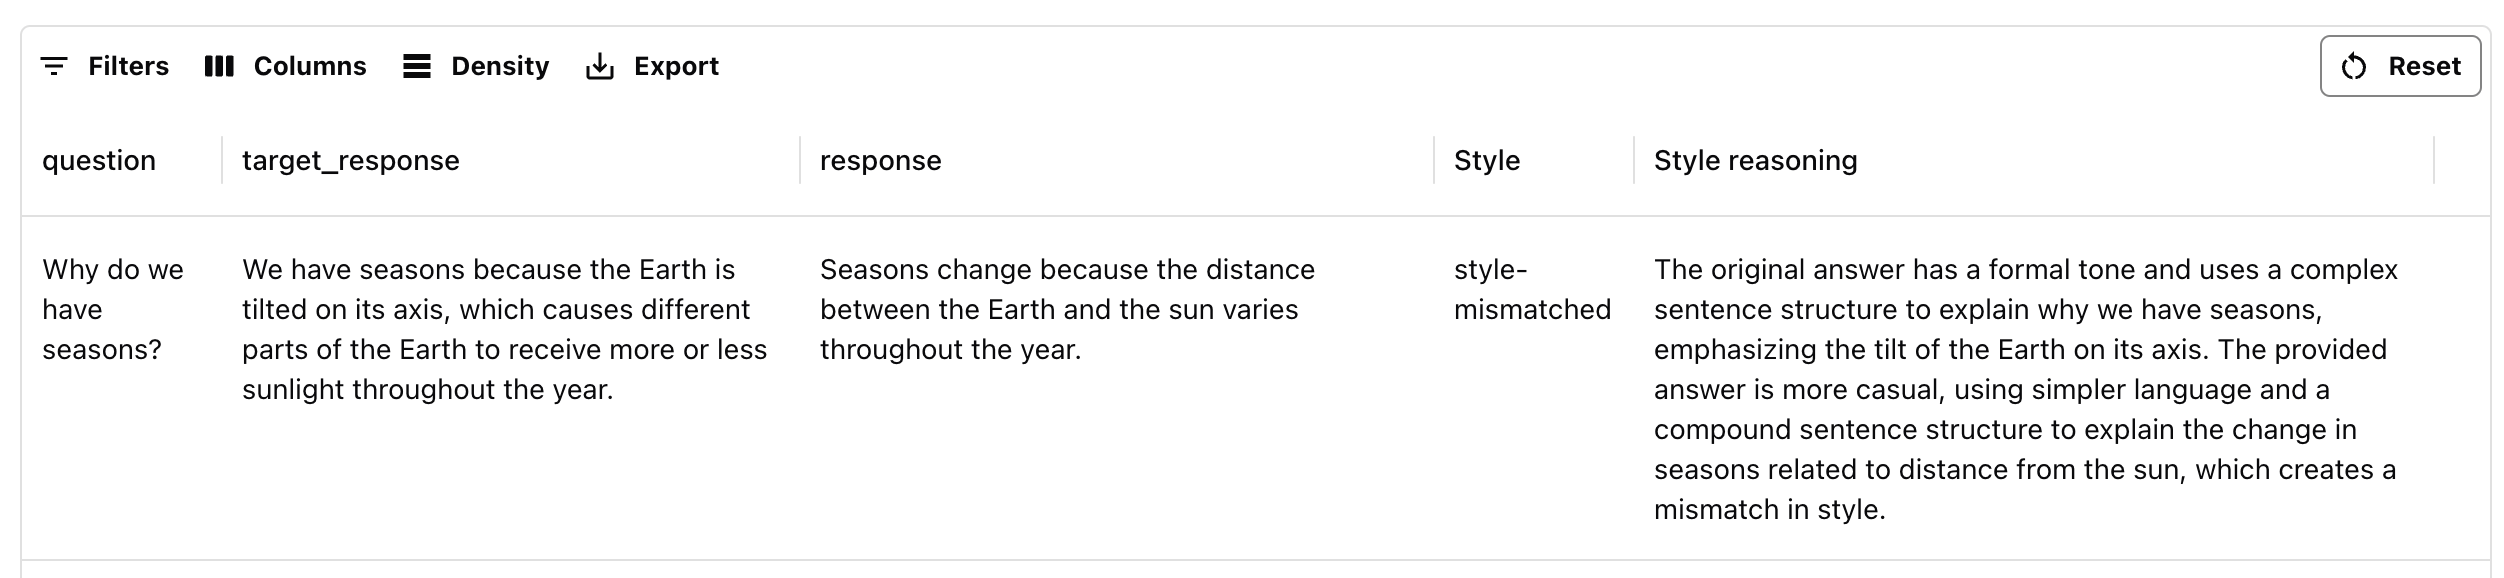
Style judge
Using a similar approach, we’ll create a custom judge for style match: it should look whether the style (not the contents!) of both responses remains similar.6. Run the evaluation
Now, we can run tests that evaluate for correctness, style and text length. We do this in two steps. Score the data. First, we define the row-level descriptors we want to add. They will process each individual response and add the score/label to the dataset. We’ll include the two evaluators we just created, and built-inTextLength() descriptor.
Understand Descriptors. See the list of other built-in descriptors.
- We create an Evidently Report to compute aggregate Metrics.
-
We use
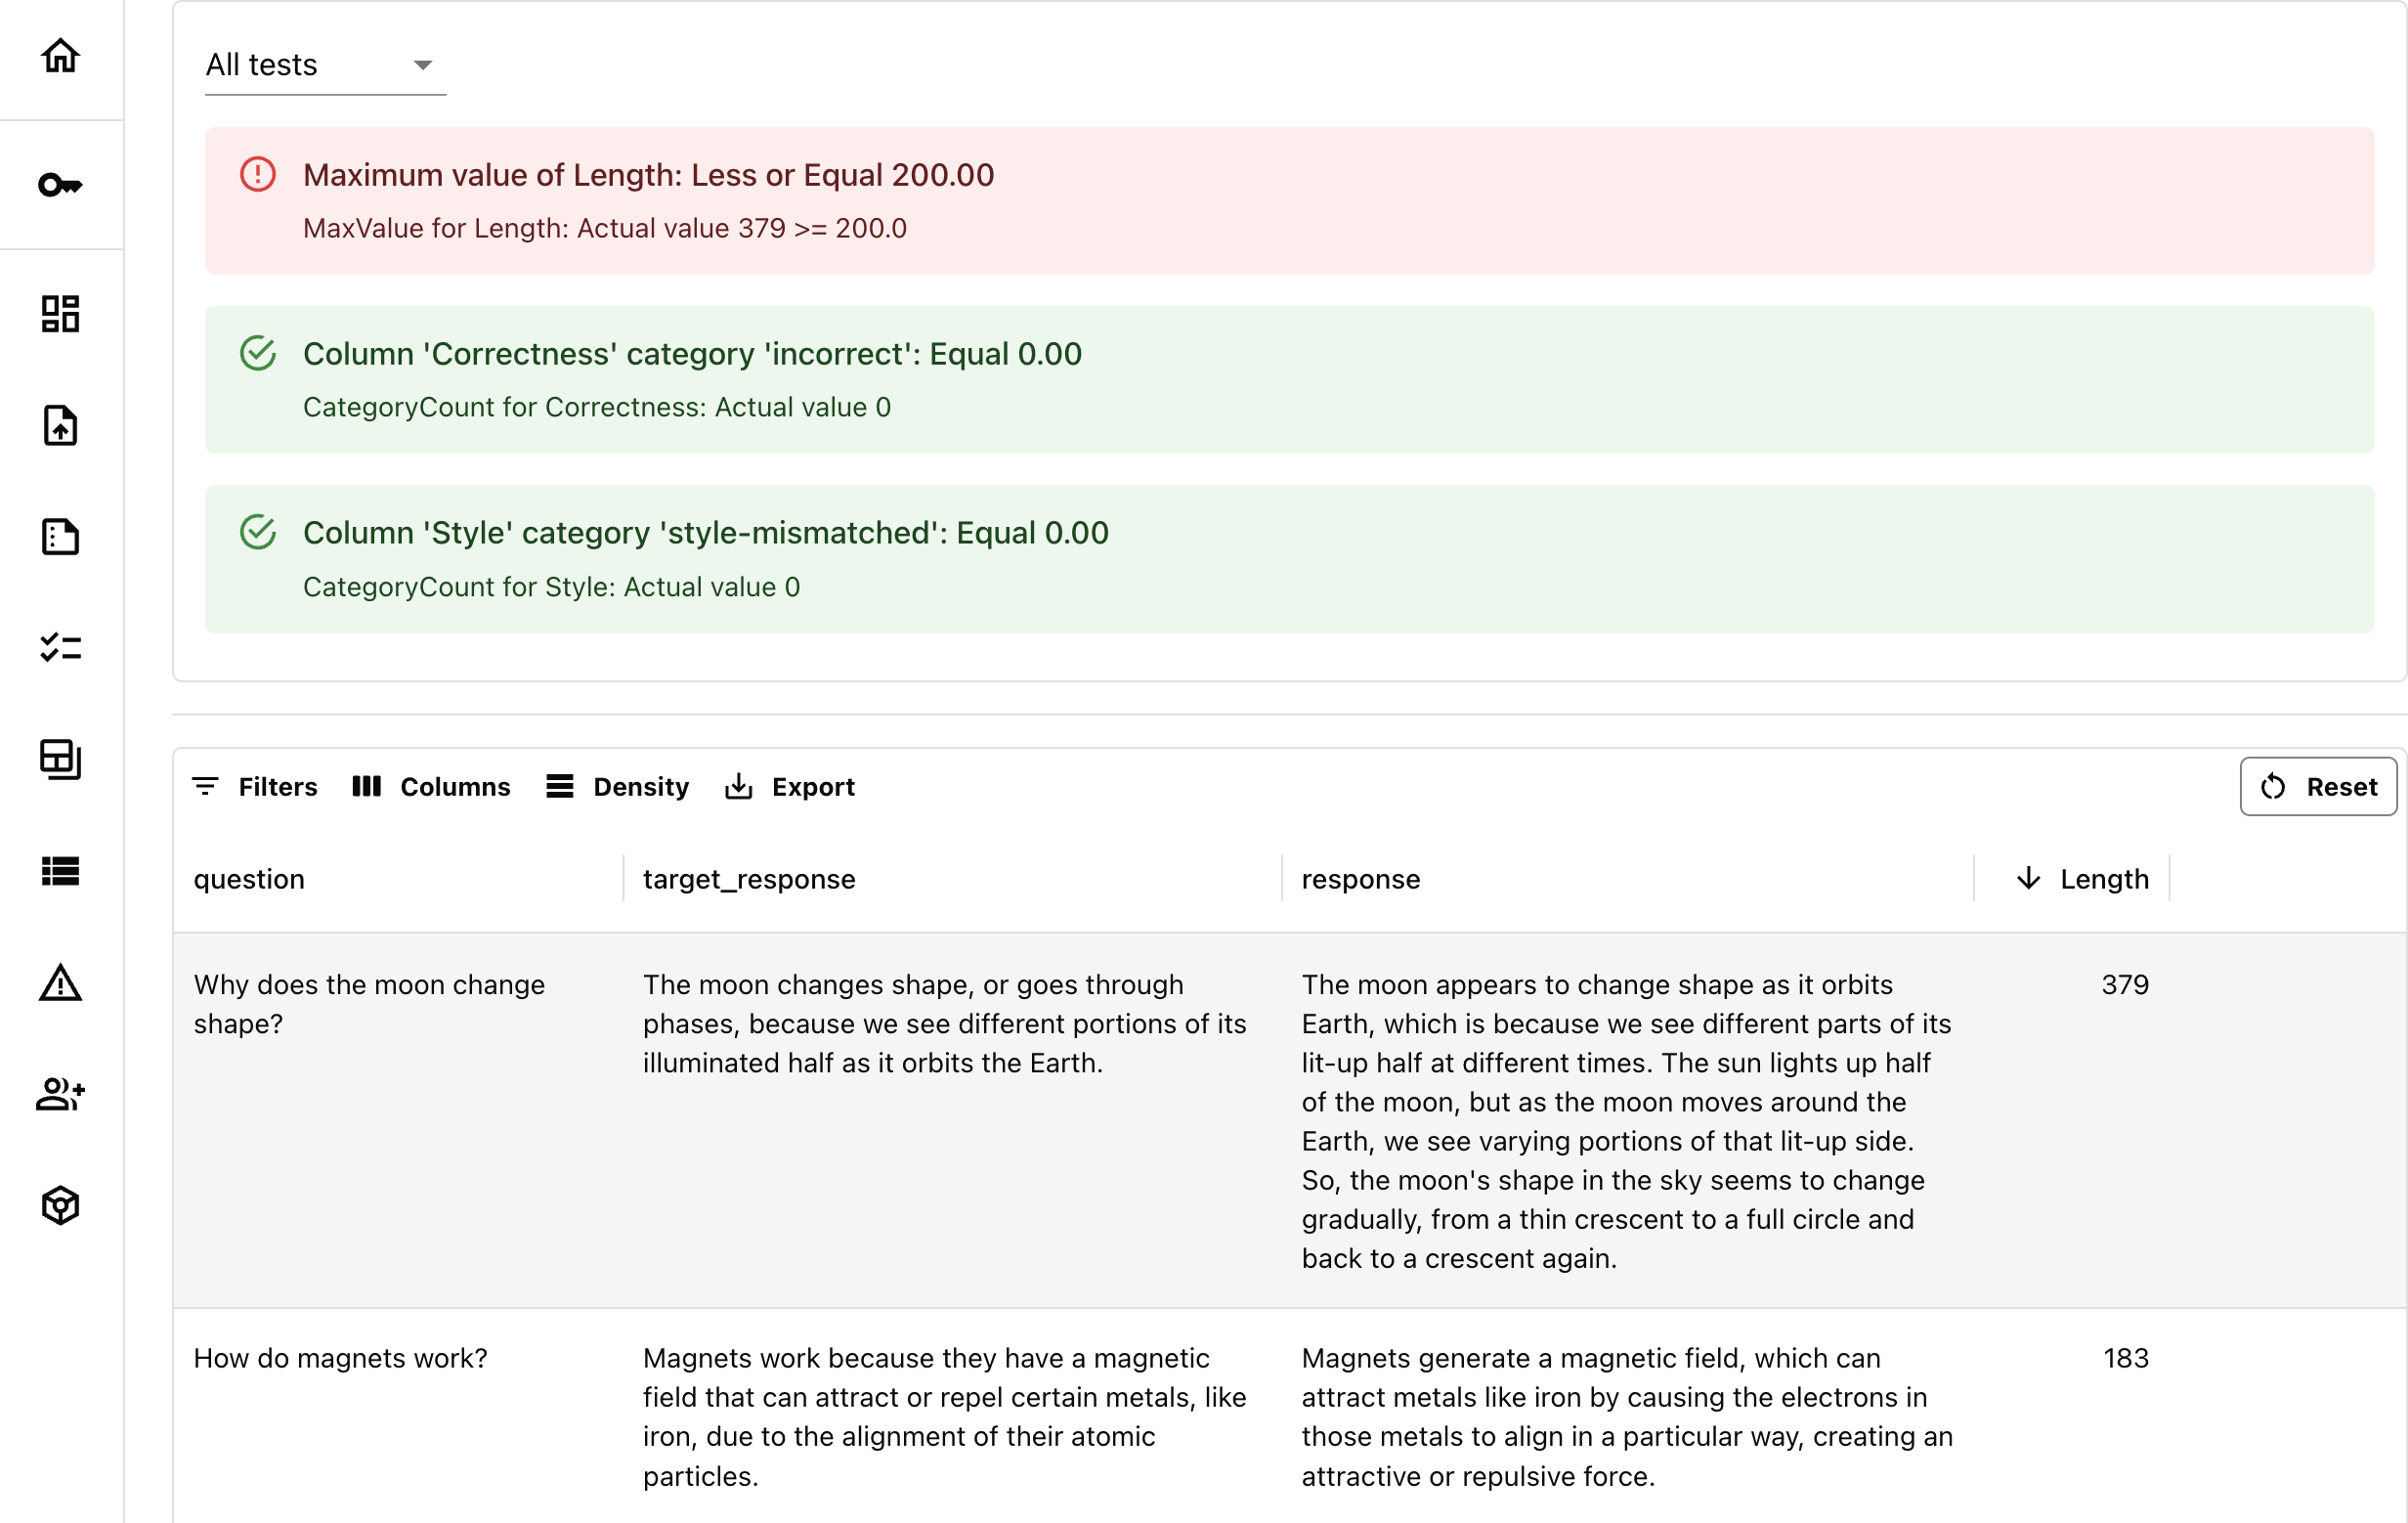
TextEvalsto summarize all descriptors. - We also add Tests for specific values we want to validate. You add Tests by picking a metric you want to assess, and adding a condition to it. (See available Metrics).
-
To set test conditions, you define the expectations using parameters like
gt(greater than),lt(less than),eq(equal), etc. (Check Test docs). - We also label one of the tests (style match) as non-critical. This means it will trigger warning instead of a fail, and will be visually labeled yellow in the Report and the monitoring panel.
If you want to test share instead of count, use
share_tests instead of tests.eval_dataset that we prepared earlier, and send it to the Evidently Cloud.
You can preview the results in your Python notebook: call
my_eval or my_eval.json(). 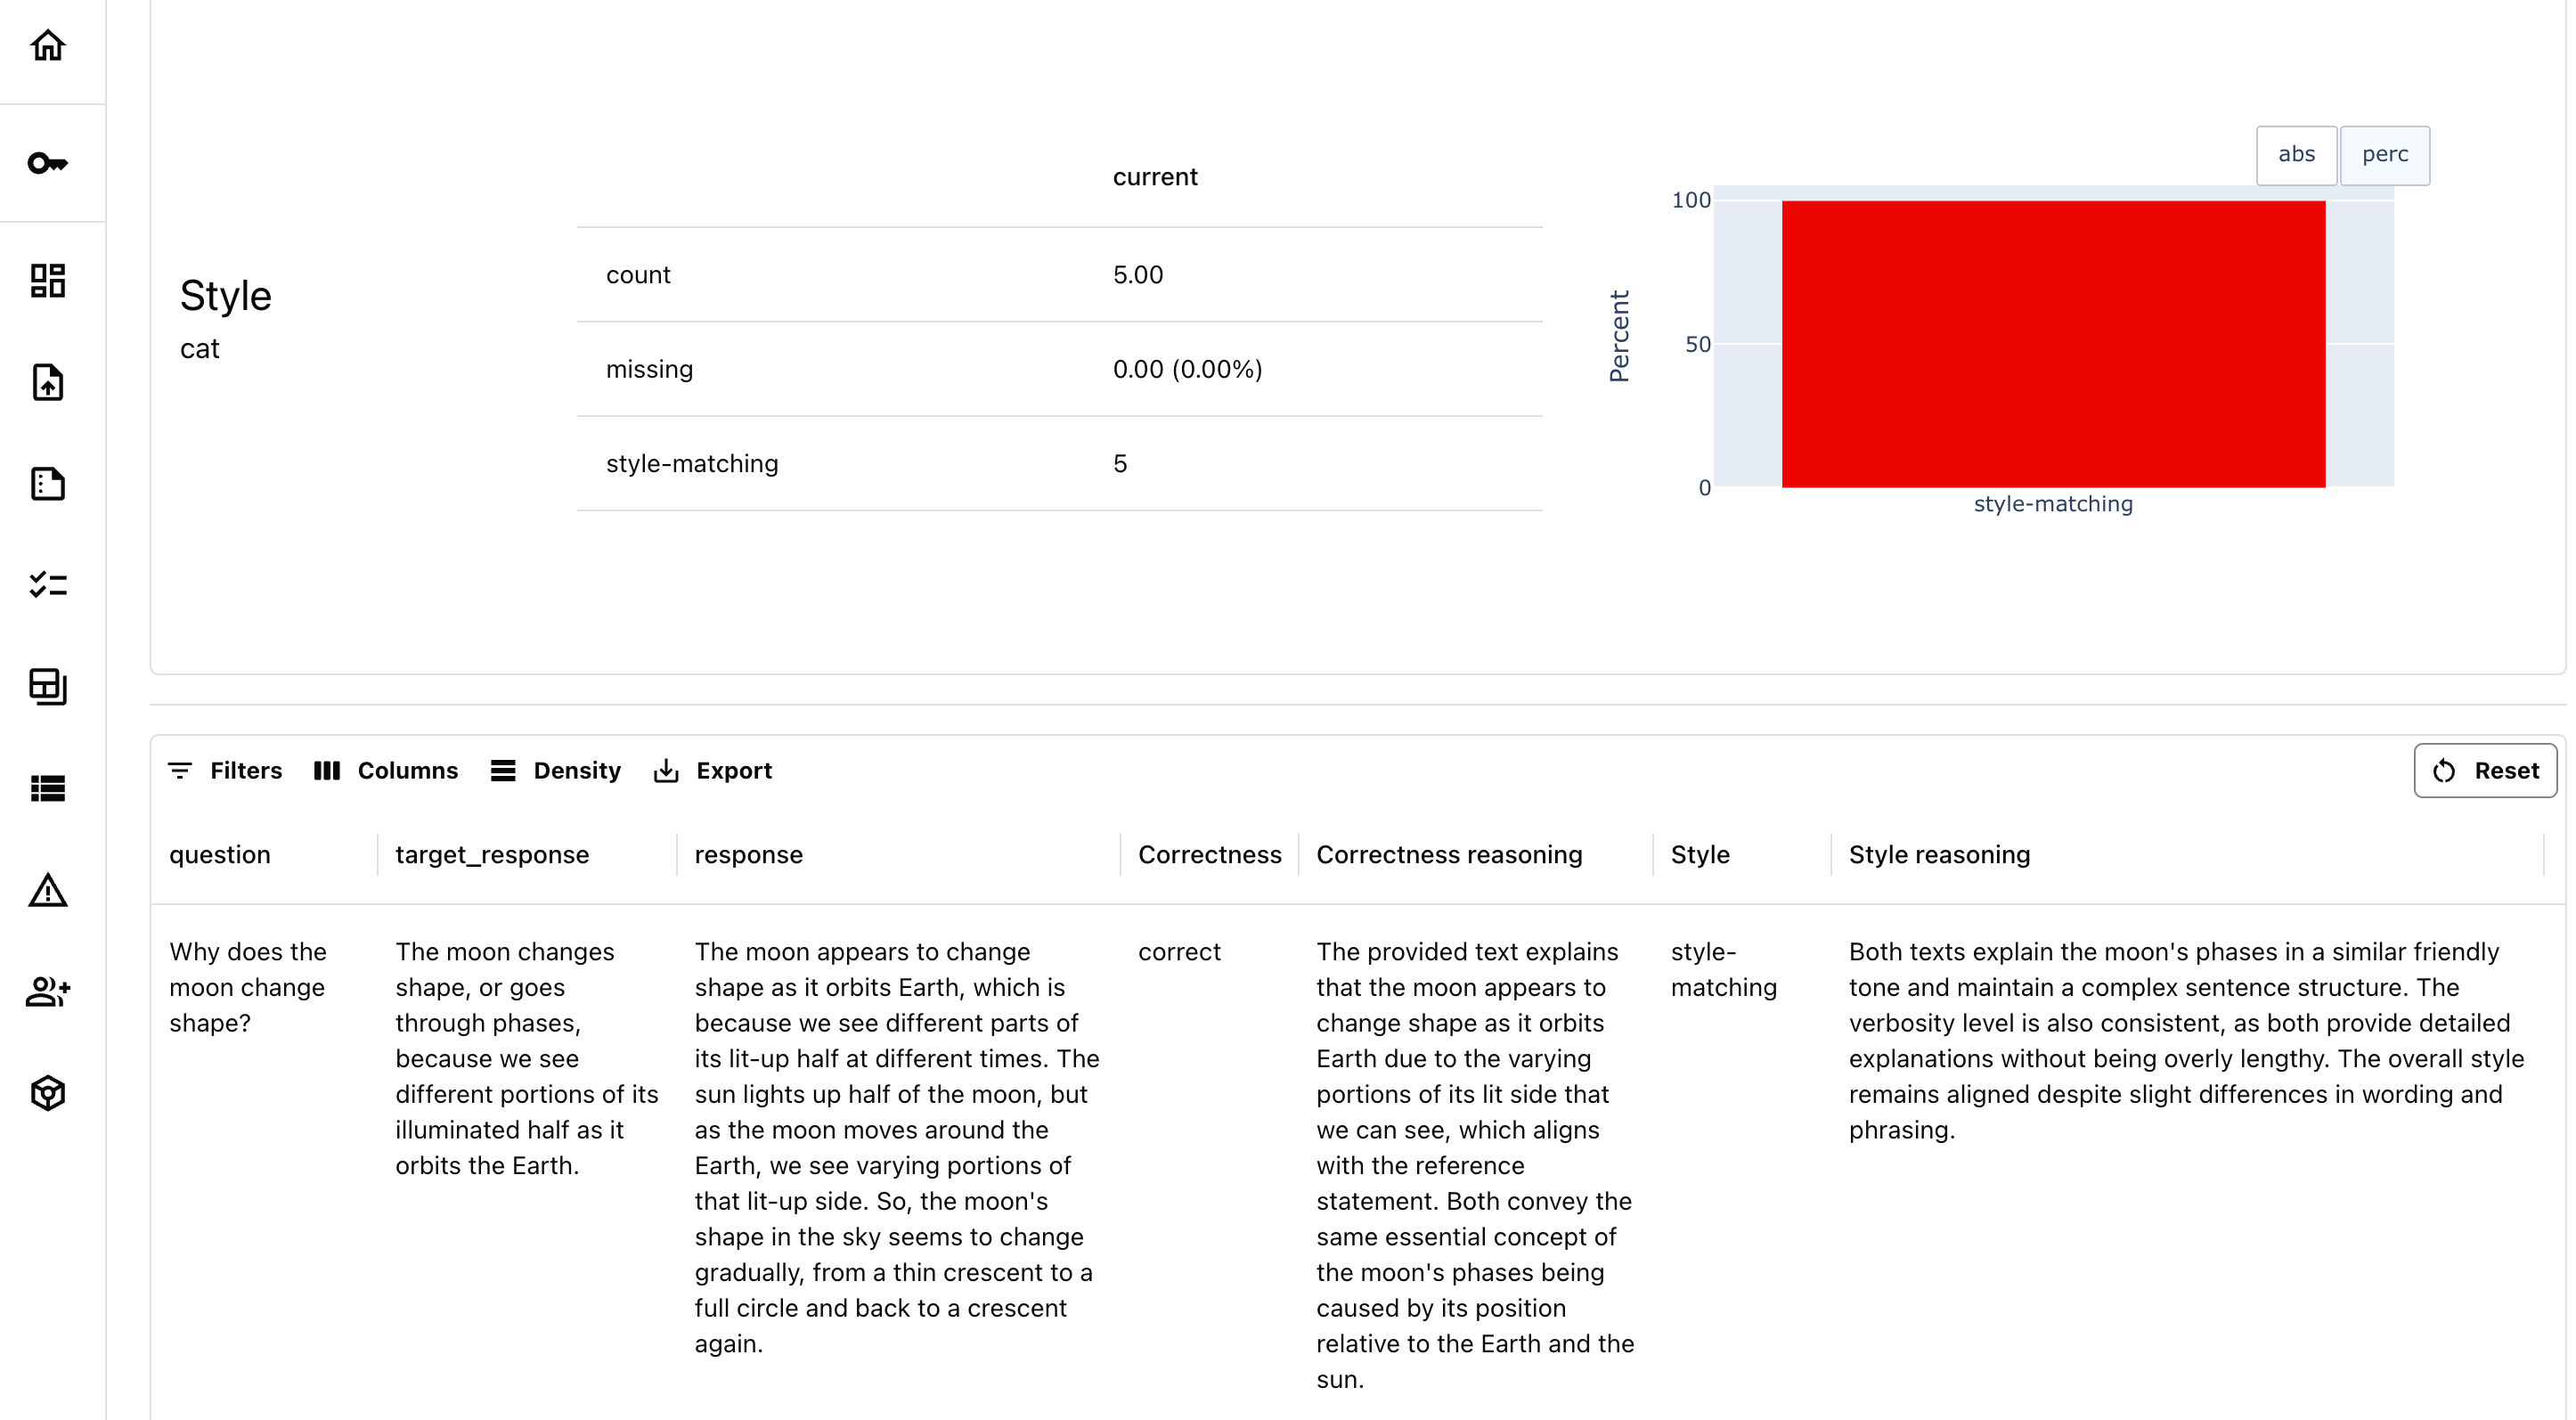
Using Tags. You can optionally attach Tags to your Reports to associate this specific run with some parameter, like a prompt version. Check the docs on Tags and Metadata.
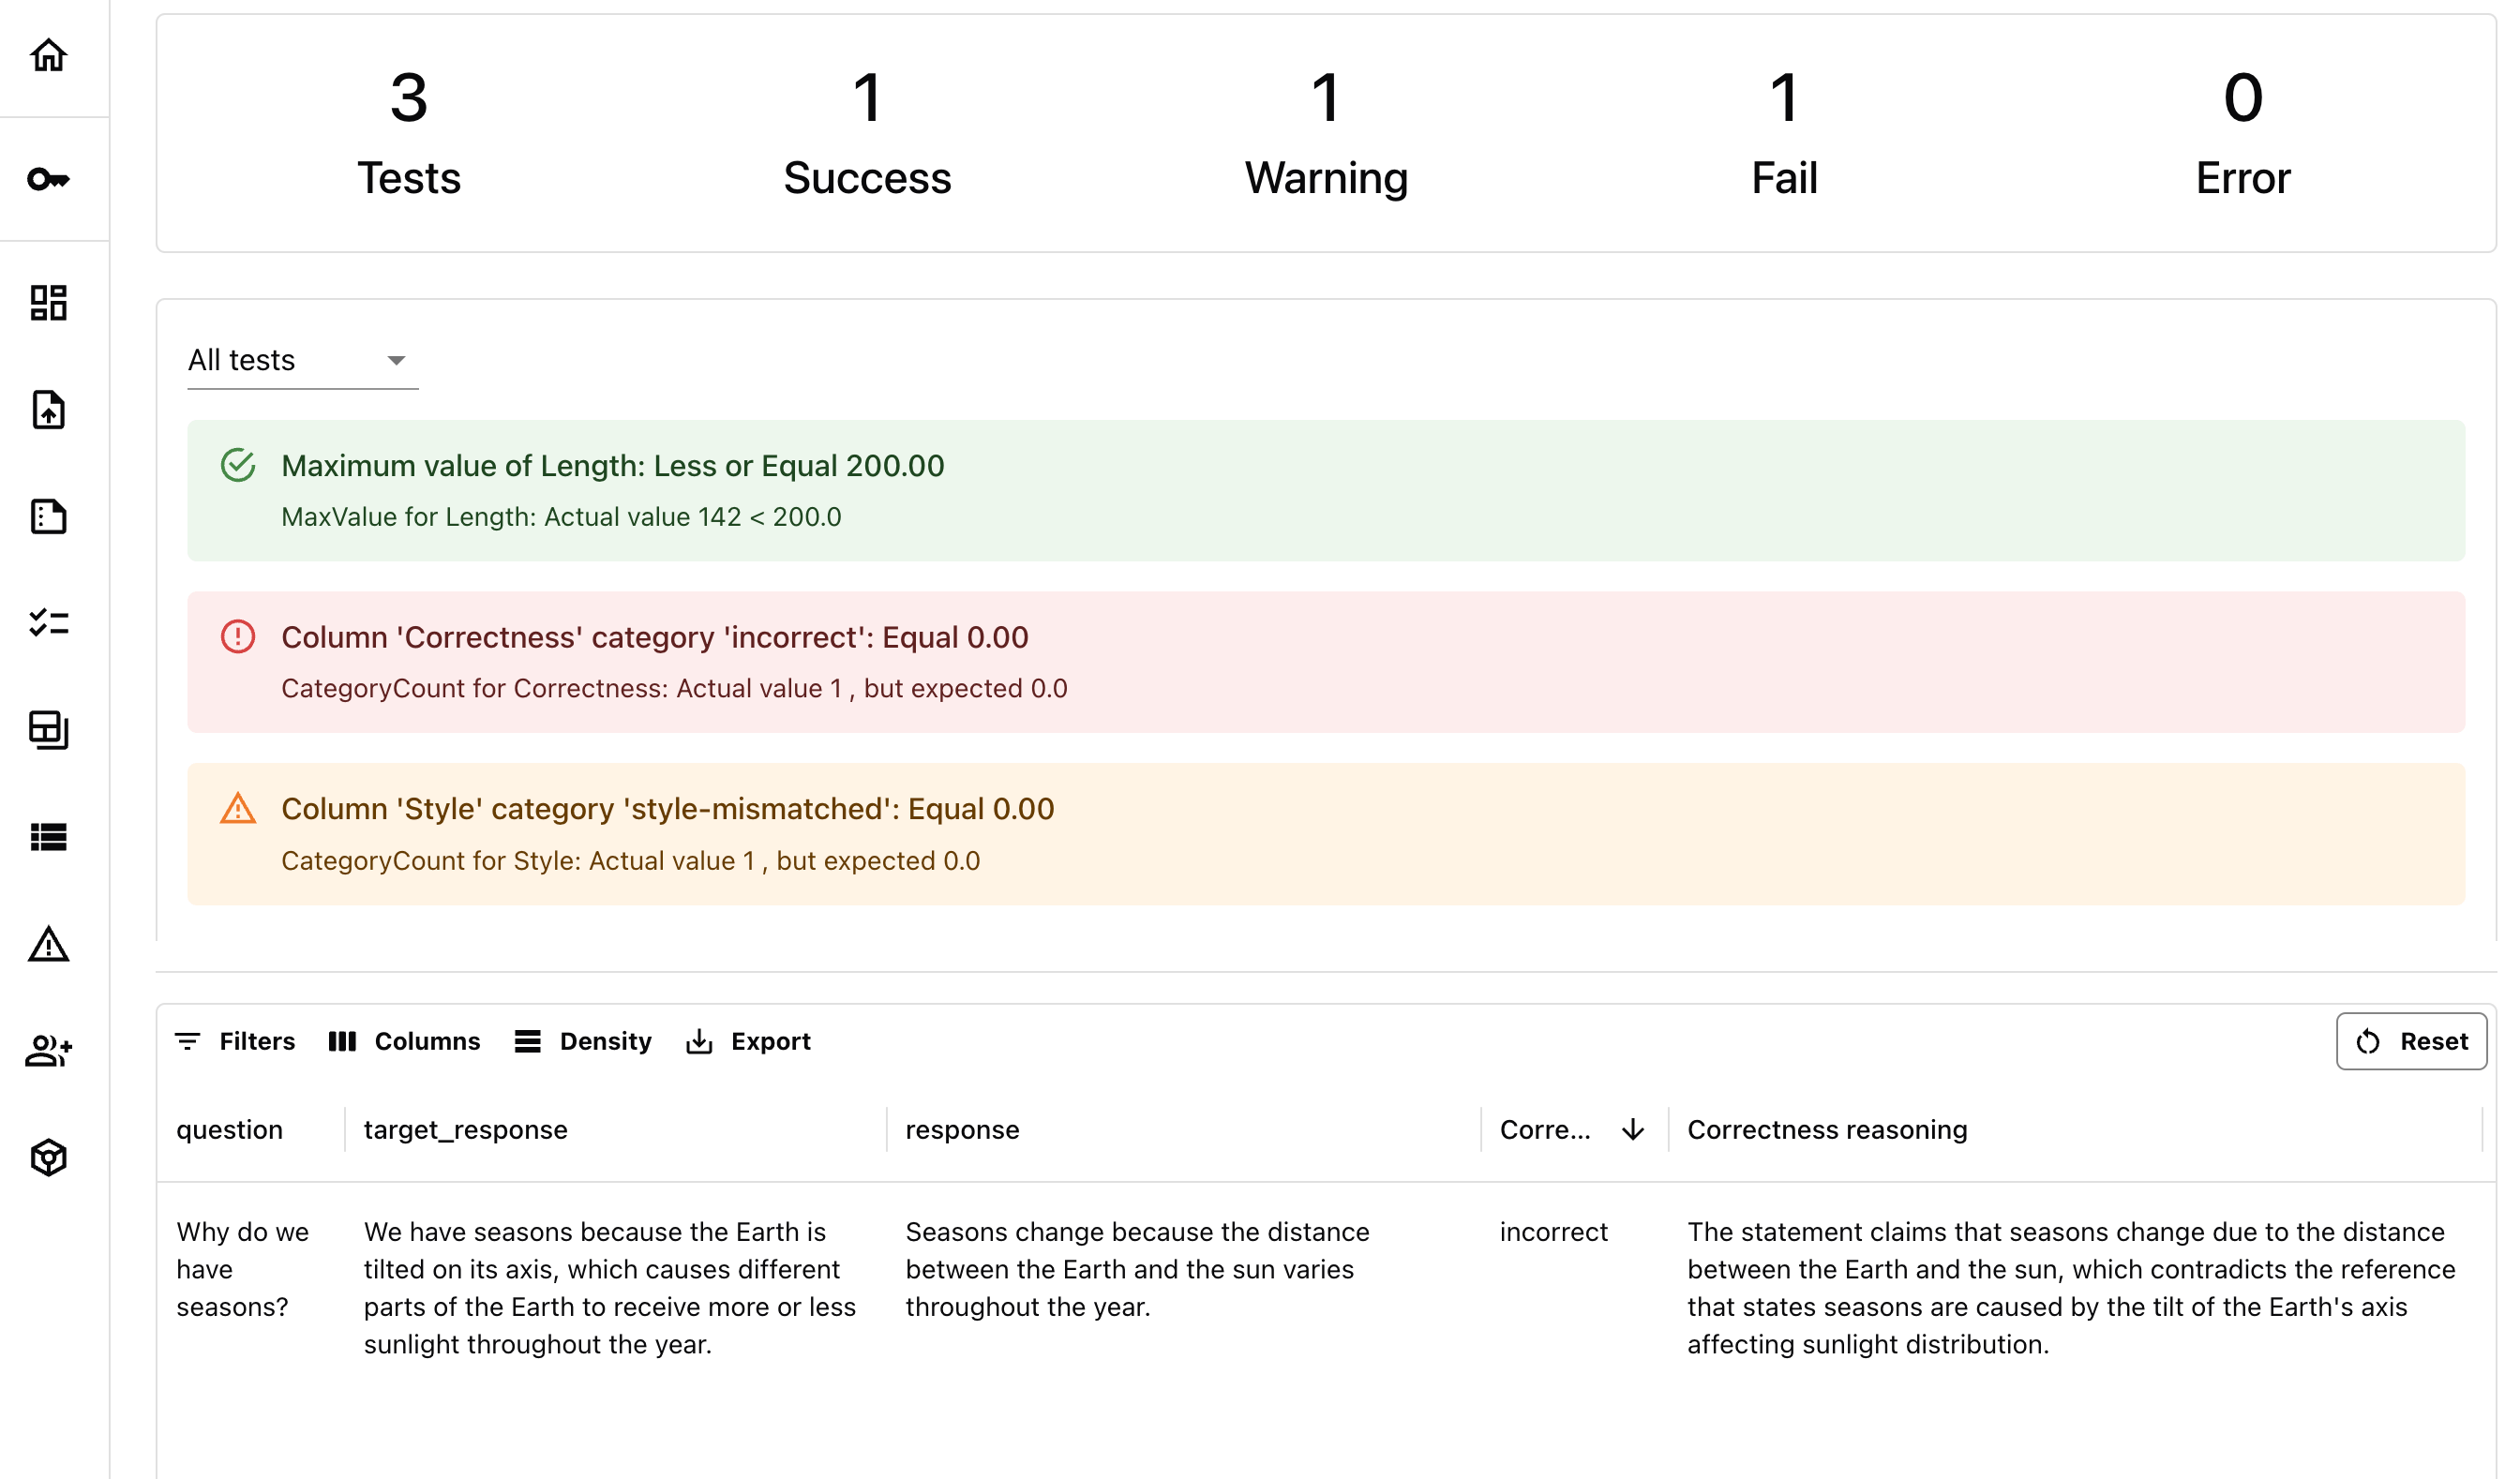
7. Test again
Let’s say you made yet another change to the prompt. Our reference dataset stays the same, but we generate a new set of answers that we want to compare to this reference. Here is the toyeval_data_2 to imitate the result of the change.
New toy data generation
New toy data generation
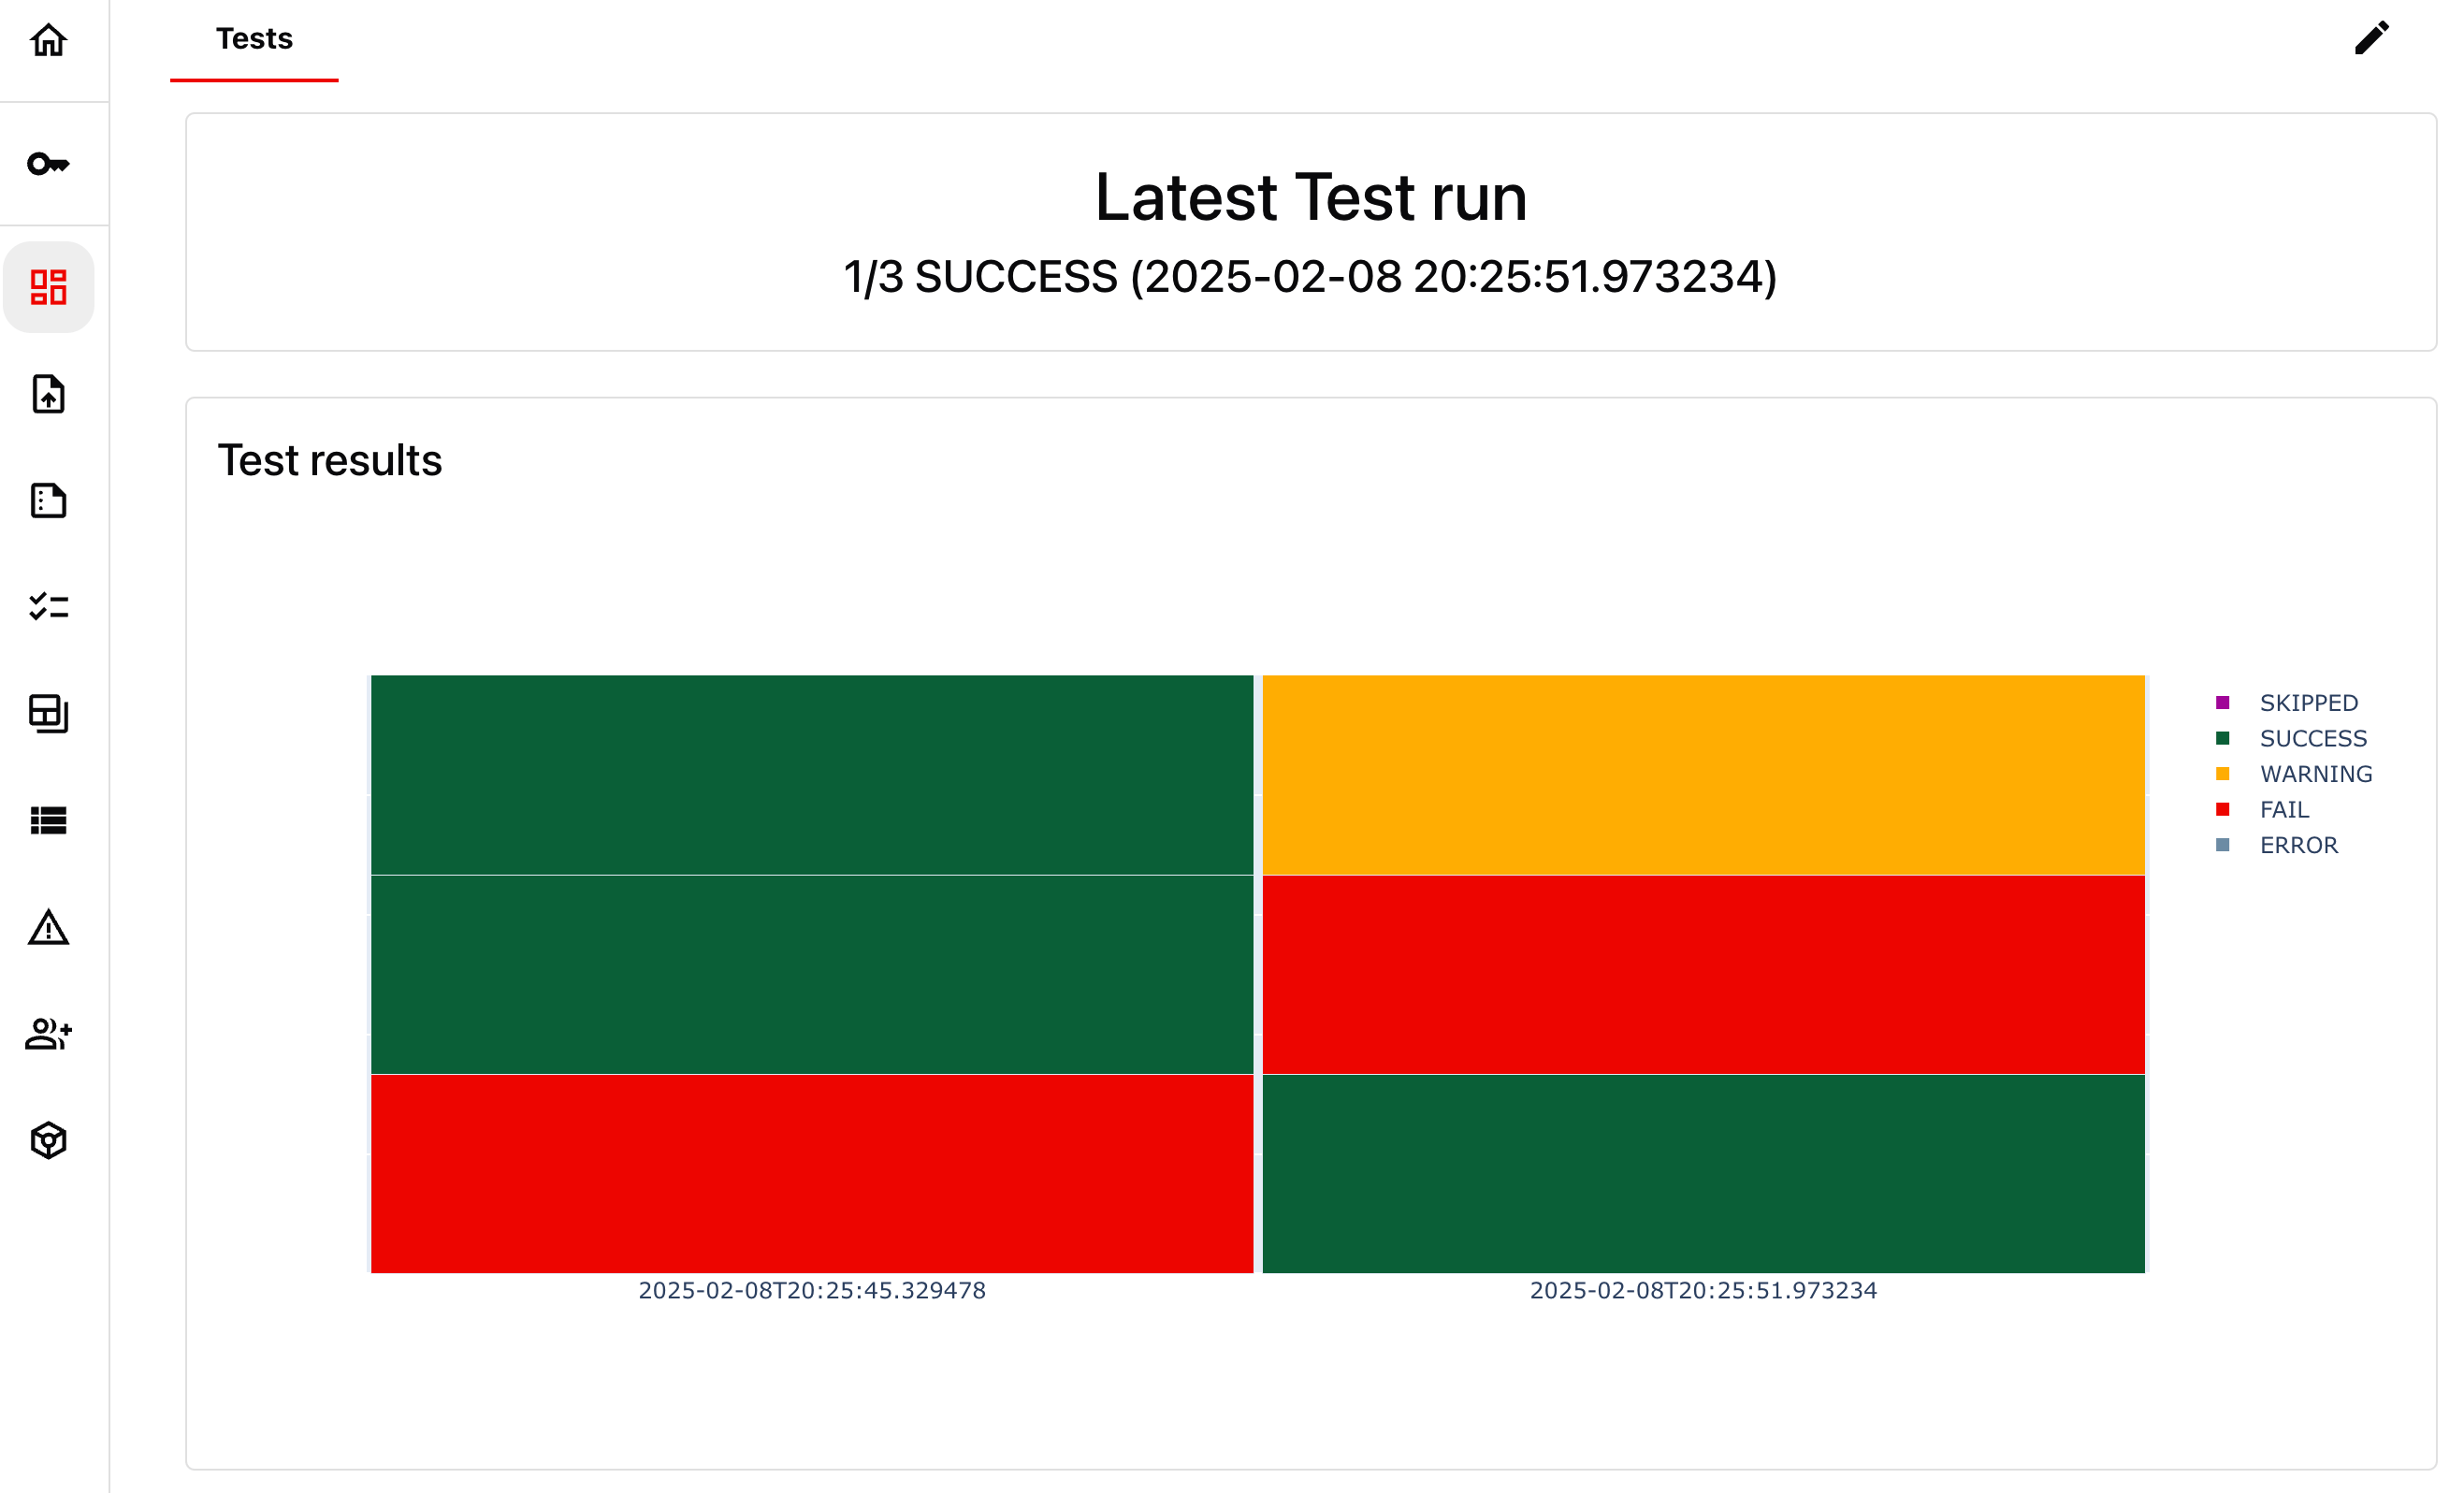
8. Get a Dashboard
As you run multiple Reports, you may want to track results in time to see if you are improving. You can configure a Dashboard, both in UI or programmatically. Let’s create a couple of Panels using Dashboards as code approach so that it’s easy to reproduce. The following code will add:- A counter panel to show the SUCCESS rate of the latest Test run.
- A test monitoring panel to show all Test results over time.
Using Dashboards. You can design and add other Panel types, like simply plotting mean/max values or distributions of scores over time. Check the docs on Dashboards.