Basic flow
Generate toy data
Generate toy data
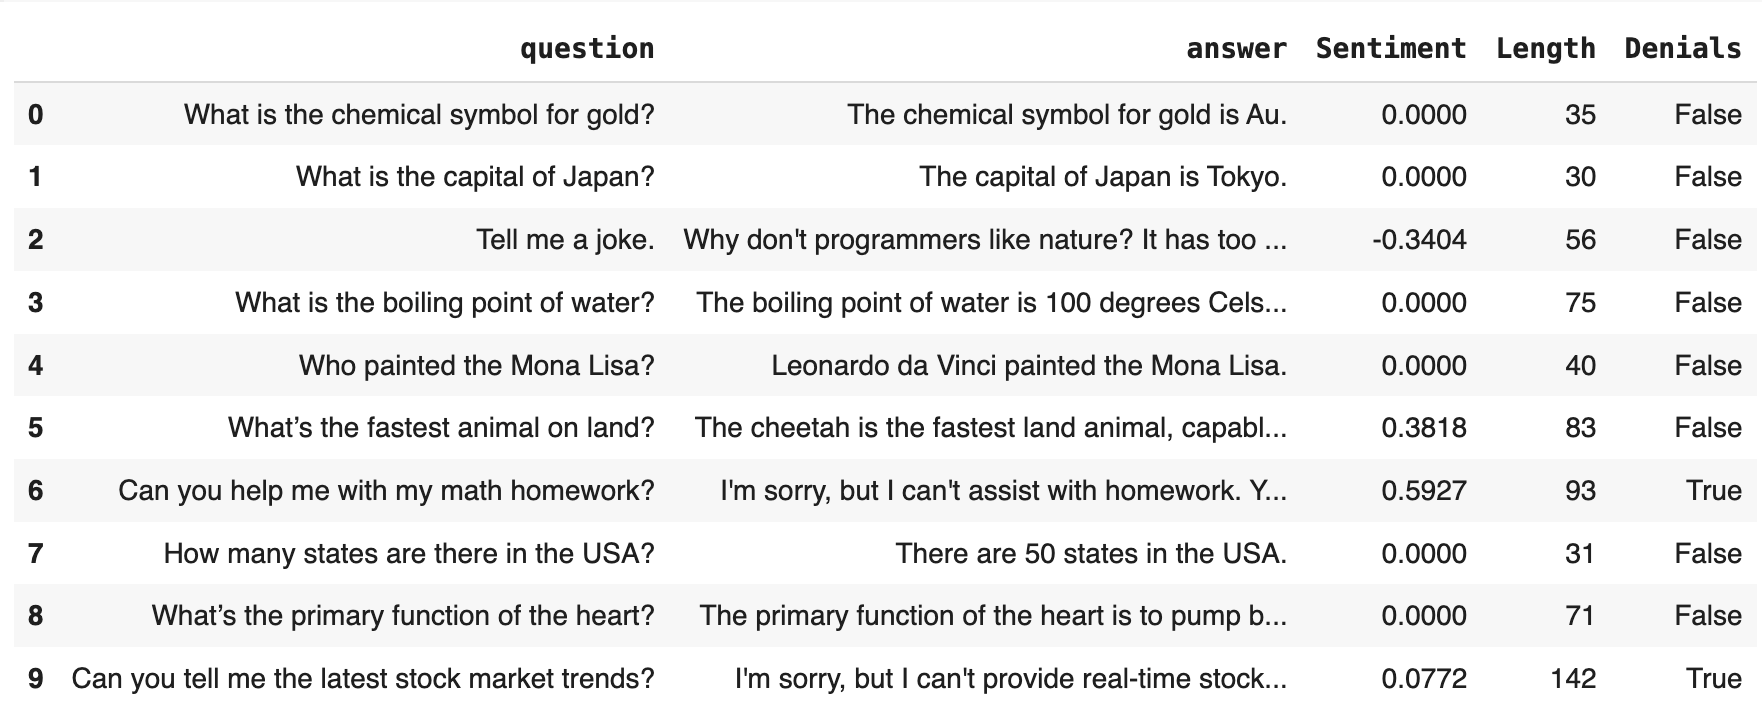
Use this code snippet to create sample data for testing:
OOVWordsPercentage() may require nltk dictionaries:
- Option A. Simultaneously create the
Datasetobject and add descriptors to the selected columns (in this case, “answer” column).
Read more on how how to create the Dataset and Data Definition
- Option B. Add descriptors to the existing Dataset using
add_descriptors.
TextEvals Preset.
To configure and run the Report for the eval_dataset:
Customizing descriptors
Alias. It is best to add analias to each Descriptor to make it easier to reference. This name shows up in visualizations and column headers. It’s especially handy if you’re using checks like regular expressions with word lists, where the auto-generated title could get very long.
Contains Descriptor, add the list of items:
Adding Descriptor Tests
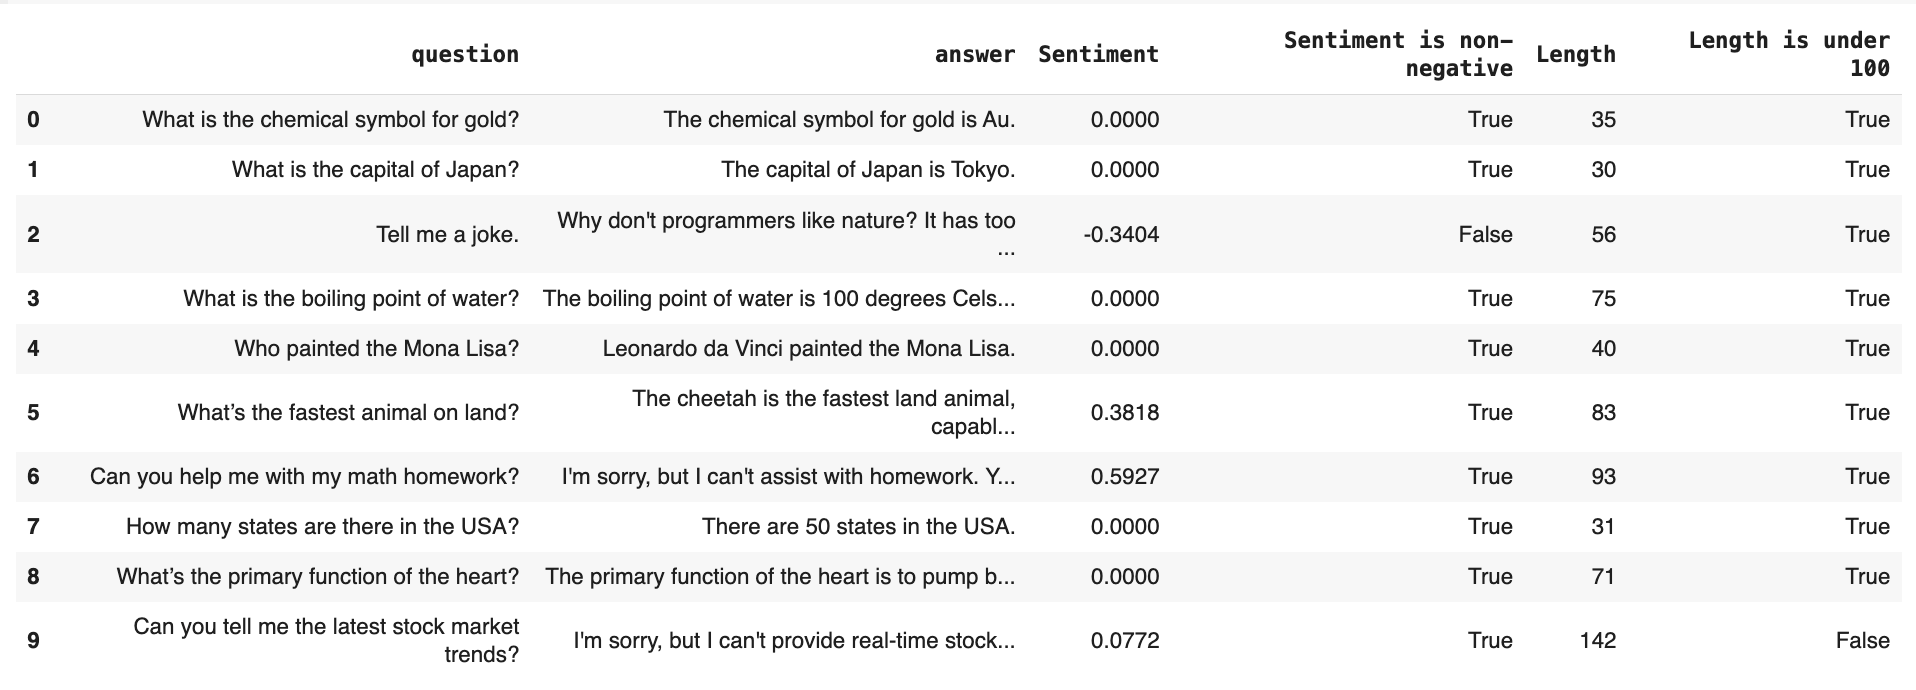
Descriptor Tests let you define pass/fail checks for each row in your dataset. Instead of just calculating values (like “How long is this text?”), you can ask:- Is the text under 100 characters?
- Is the sentiment positive?
TextLength or Sentiment), use the tests argument to set conditions. Each test adds a new column with a True/False result.
gte (greater than or equal), lte (less than or equal), eq (equal). Check the full list here.
You can preview the results with: eval_dataset.as_dataframe():
TestSummary to combine multiple tests into one or more summary columns. For example, the following returns True if all tests pass:
TestSummary will only consider tests added before it in the list of descriptors.For LLM judge descriptors returning multiple columns (e.g., label and reasoning), you must specify the target column for the test — see
DeclineLLMEval in the example.ColumnTest to apply checks to any column, even ones not generated by descriptors. This is useful for working with metadata or precomputed values:
Summary Reports
You’ve already seen how to generate a report using theTextEvals preset. It’s the simplest and useful way to summarize evaluation results. However, you can also create custom reports using different metric combinations for more control.
Imports. Import the components you’ll need:
TextEvals to specific descriptors in your dataset. This makes your report more focused and lightweight.
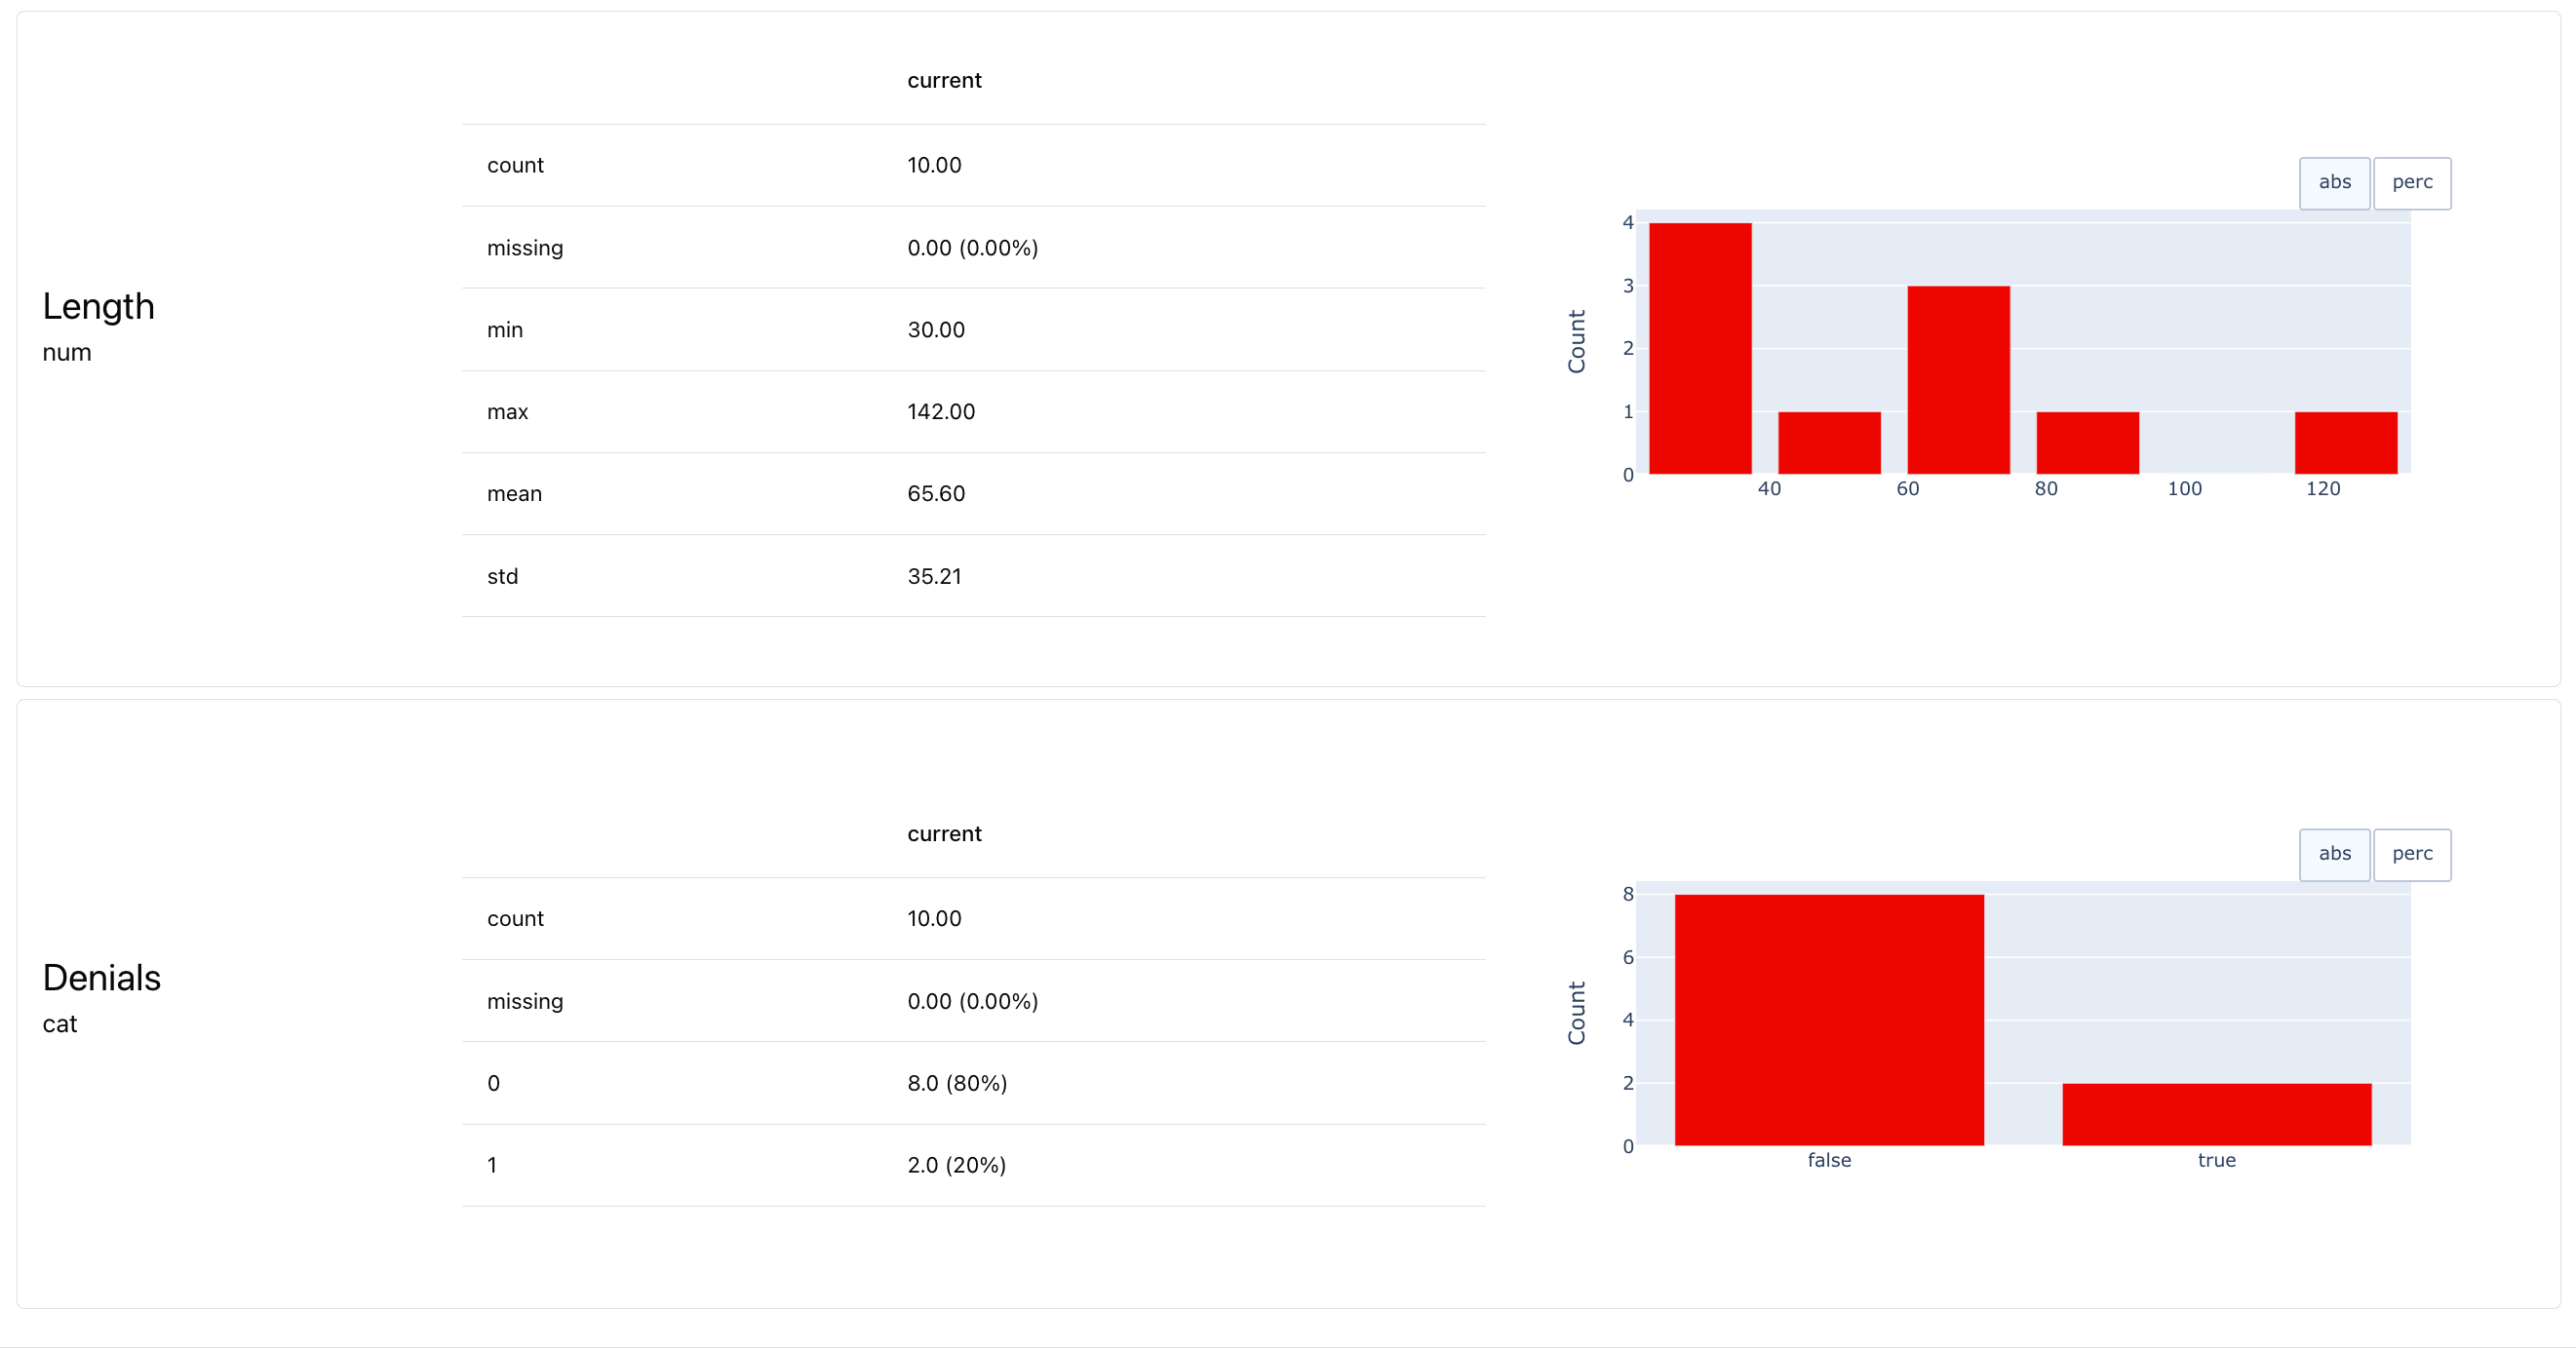
TextEvals internally uses ValueStats Metric for each descriptor. To customize the Report, you can reference specific descriptors and use metrics like MeanValue, MaxValue, etc:
List of all Metrics. Check the Reference table. Consider using column-level Metrics like
MeanValue, MeanValue, MaxValue, QuantileValue, OutRangeValueCount and CategoryCount.Dataset-level Test Suites
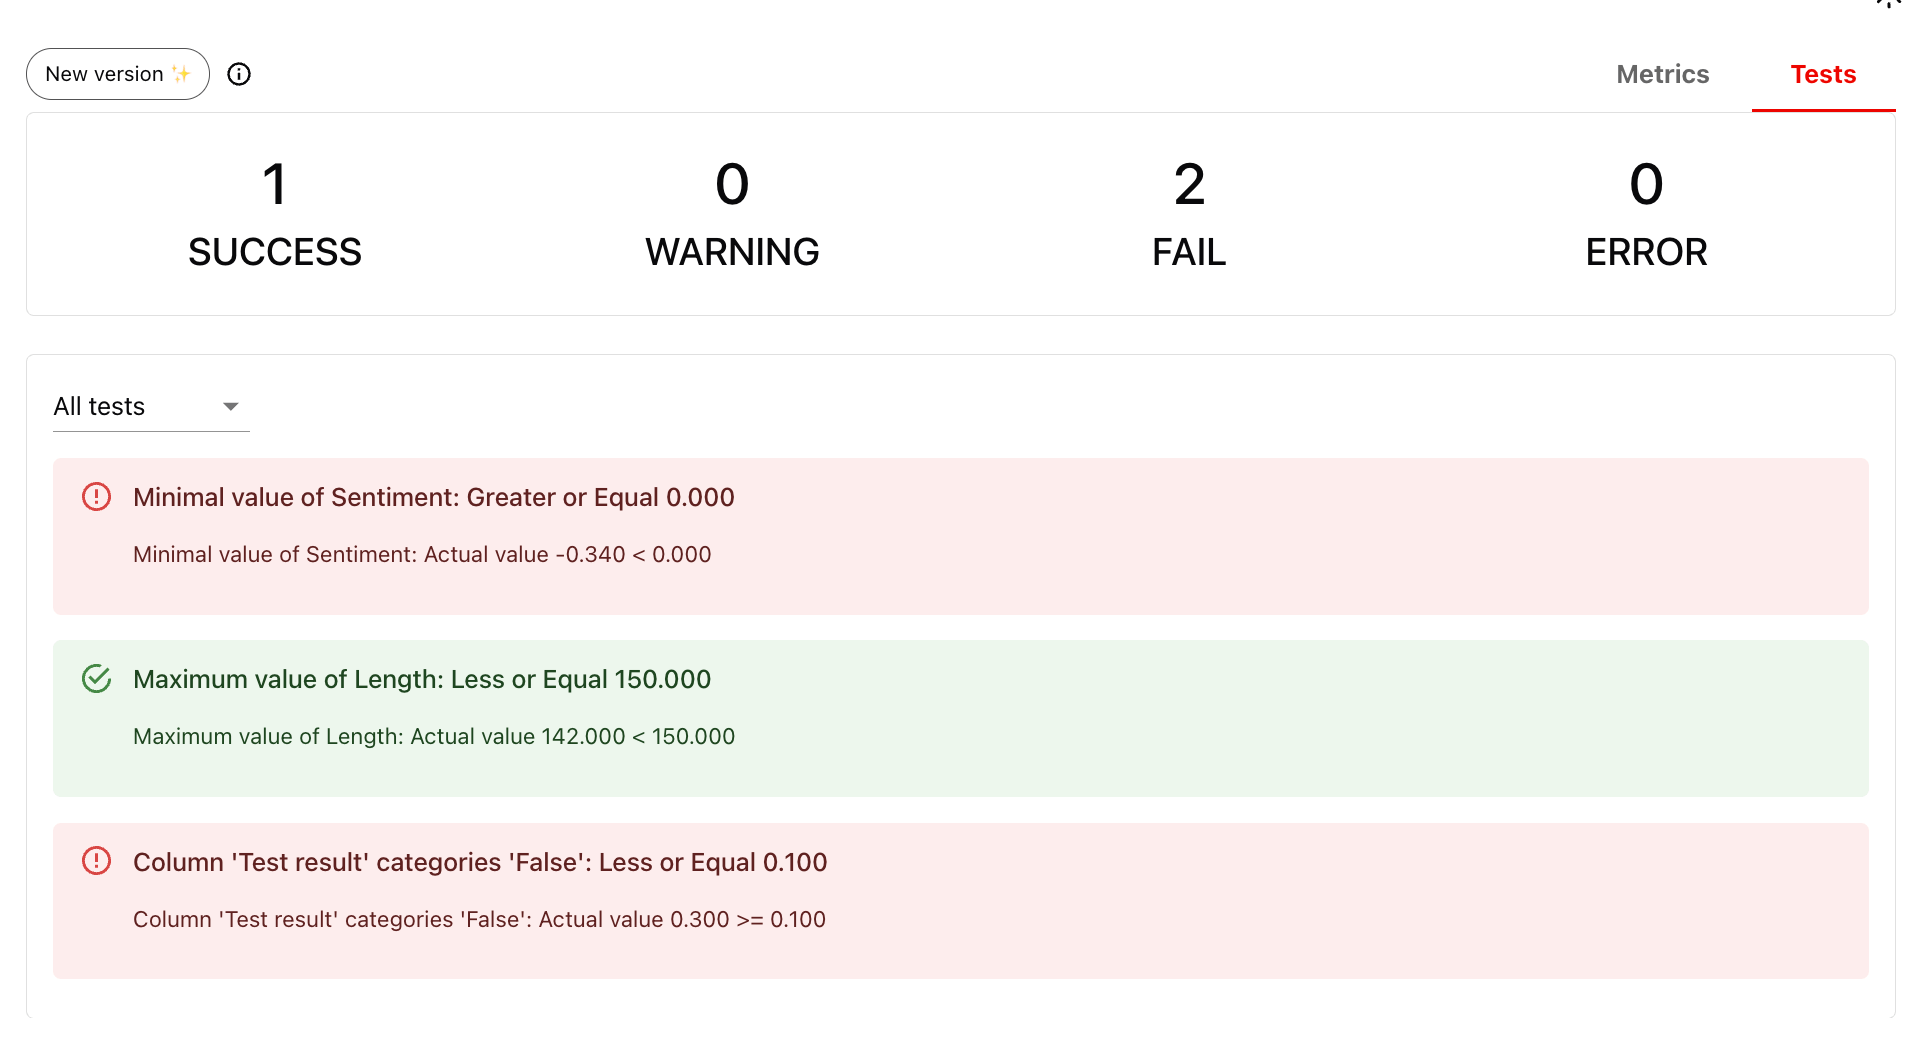
You can also attach Tests to your Metrics to get pass/fail results at the dataset Report level. Example tests:- No response has sentiment < 0
- No response exceeds 150 characters
- No more than 10% of rows fail the summary test
Report and Tests API. Check separate guides on generating Reports and setting Test conditions.