Need help? Ask on Discord.

Evidently helps you run tests and evaluations for your production ML systems. This includes:

  • evaluating prediction quality (e.g. classification or regression accuracy)
  • input data quality (e.g. missing values, out-of-range features)
  • data and prediction drift.

Evaluating distribution shifts (data drift) in ML inputs and predictions is a typical use case that helps you detect shifts in the model quality and environment even without ground truth labels.

In this Quickstart, you’ll run a simple data drift report in Python and view the results in Evidently Cloud. If you want to stay fully local, you can also do that - just skip a couple steps.

1. Set up your environment

For a fully local flow, skip steps 1.1 and 1.3.

1.1. Set up Evidently Cloud

  • Sign up for a free Evidently Cloud account.

  • Create an Organization if you log in for the first time. Get an ID of your organization. (Link).

  • Get an API token. Click the Key icon in the left menu. Generate and save the token. (Link).

1.2. Installation and imports

Install the Evidently Python library:

!pip install evidently

Components to run the evals:

import pandas as pd
from sklearn import datasets
    
from evidently import Dataset
from evidently import DataDefinition
from evidently import Report
from evidently.presets import DataDriftPreset, DataSummaryPreset 

Components to connect with Evidently Cloud:

from evidently.ui.workspace import CloudWorkspace

1.3. Create a Project

Connect to Evidently Cloud using your API token:

ws = CloudWorkspace(token="YOUR_API_TOKEN", url="https://app.evidently.cloud")

Create a Project within your Organization, or connect to an existing Project:

project = ws.create_project("My project name", org_id="YOUR_ORG_ID")
project.description = "My project description"
project.save()

# or project = ws.get_project("PROJECT_ID")

2. Prepare a toy dataset

Let’s import a toy dataset with tabular data:

adult_data = datasets.fetch_openml(name="adult", version=2, as_frame="auto")
adult = adult_data.frame

Let’s split the data into two and introduce some artificial drift for demo purposes. Prod data will include people with education levels unseen in the reference dataset:

adult_ref = adult[~adult.education.isin(["Some-college", "HS-grad", "Bachelors"])]
adult_prod = adult[adult.education.isin(["Some-college", "HS-grad", "Bachelors"])]

Map the column types:

schema = DataDefinition(
    numerical_columns=["education-num", "age", "capital-gain", "hours-per-week", "capital-loss", "fnlwgt"],
    categorical_columns=["education", "occupation", "native-country", "workclass", "marital-status", "relationship", "race", "sex", "class"],
    )

Create Evidently Datasets to work with:

eval_data_1 = Dataset.from_pandas(
    pd.DataFrame(adult_prod),
    data_definition=schema
)
eval_data_2 = Dataset.from_pandas(
    pd.DataFrame(adult_ref),
    data_definition=schema
)

Eval_data_2 will be our reference dataset we’ll compare against.

3. Get a Report

Let’s generate a Data Drift preset that will check for statistical distribution changes between all columns in the dataset.

report = Report([
    DataDriftPreset() 
])

my_eval = report.run(eval_data_1, eval_data_2)

You can customize drift parameters by choosing different methods and thresholds. In our case we proceed as is so default tests selected by Evidently will apply.

4. Explore the results

Local preview. In a Python environment like Jupyter notebook or Colab, run:
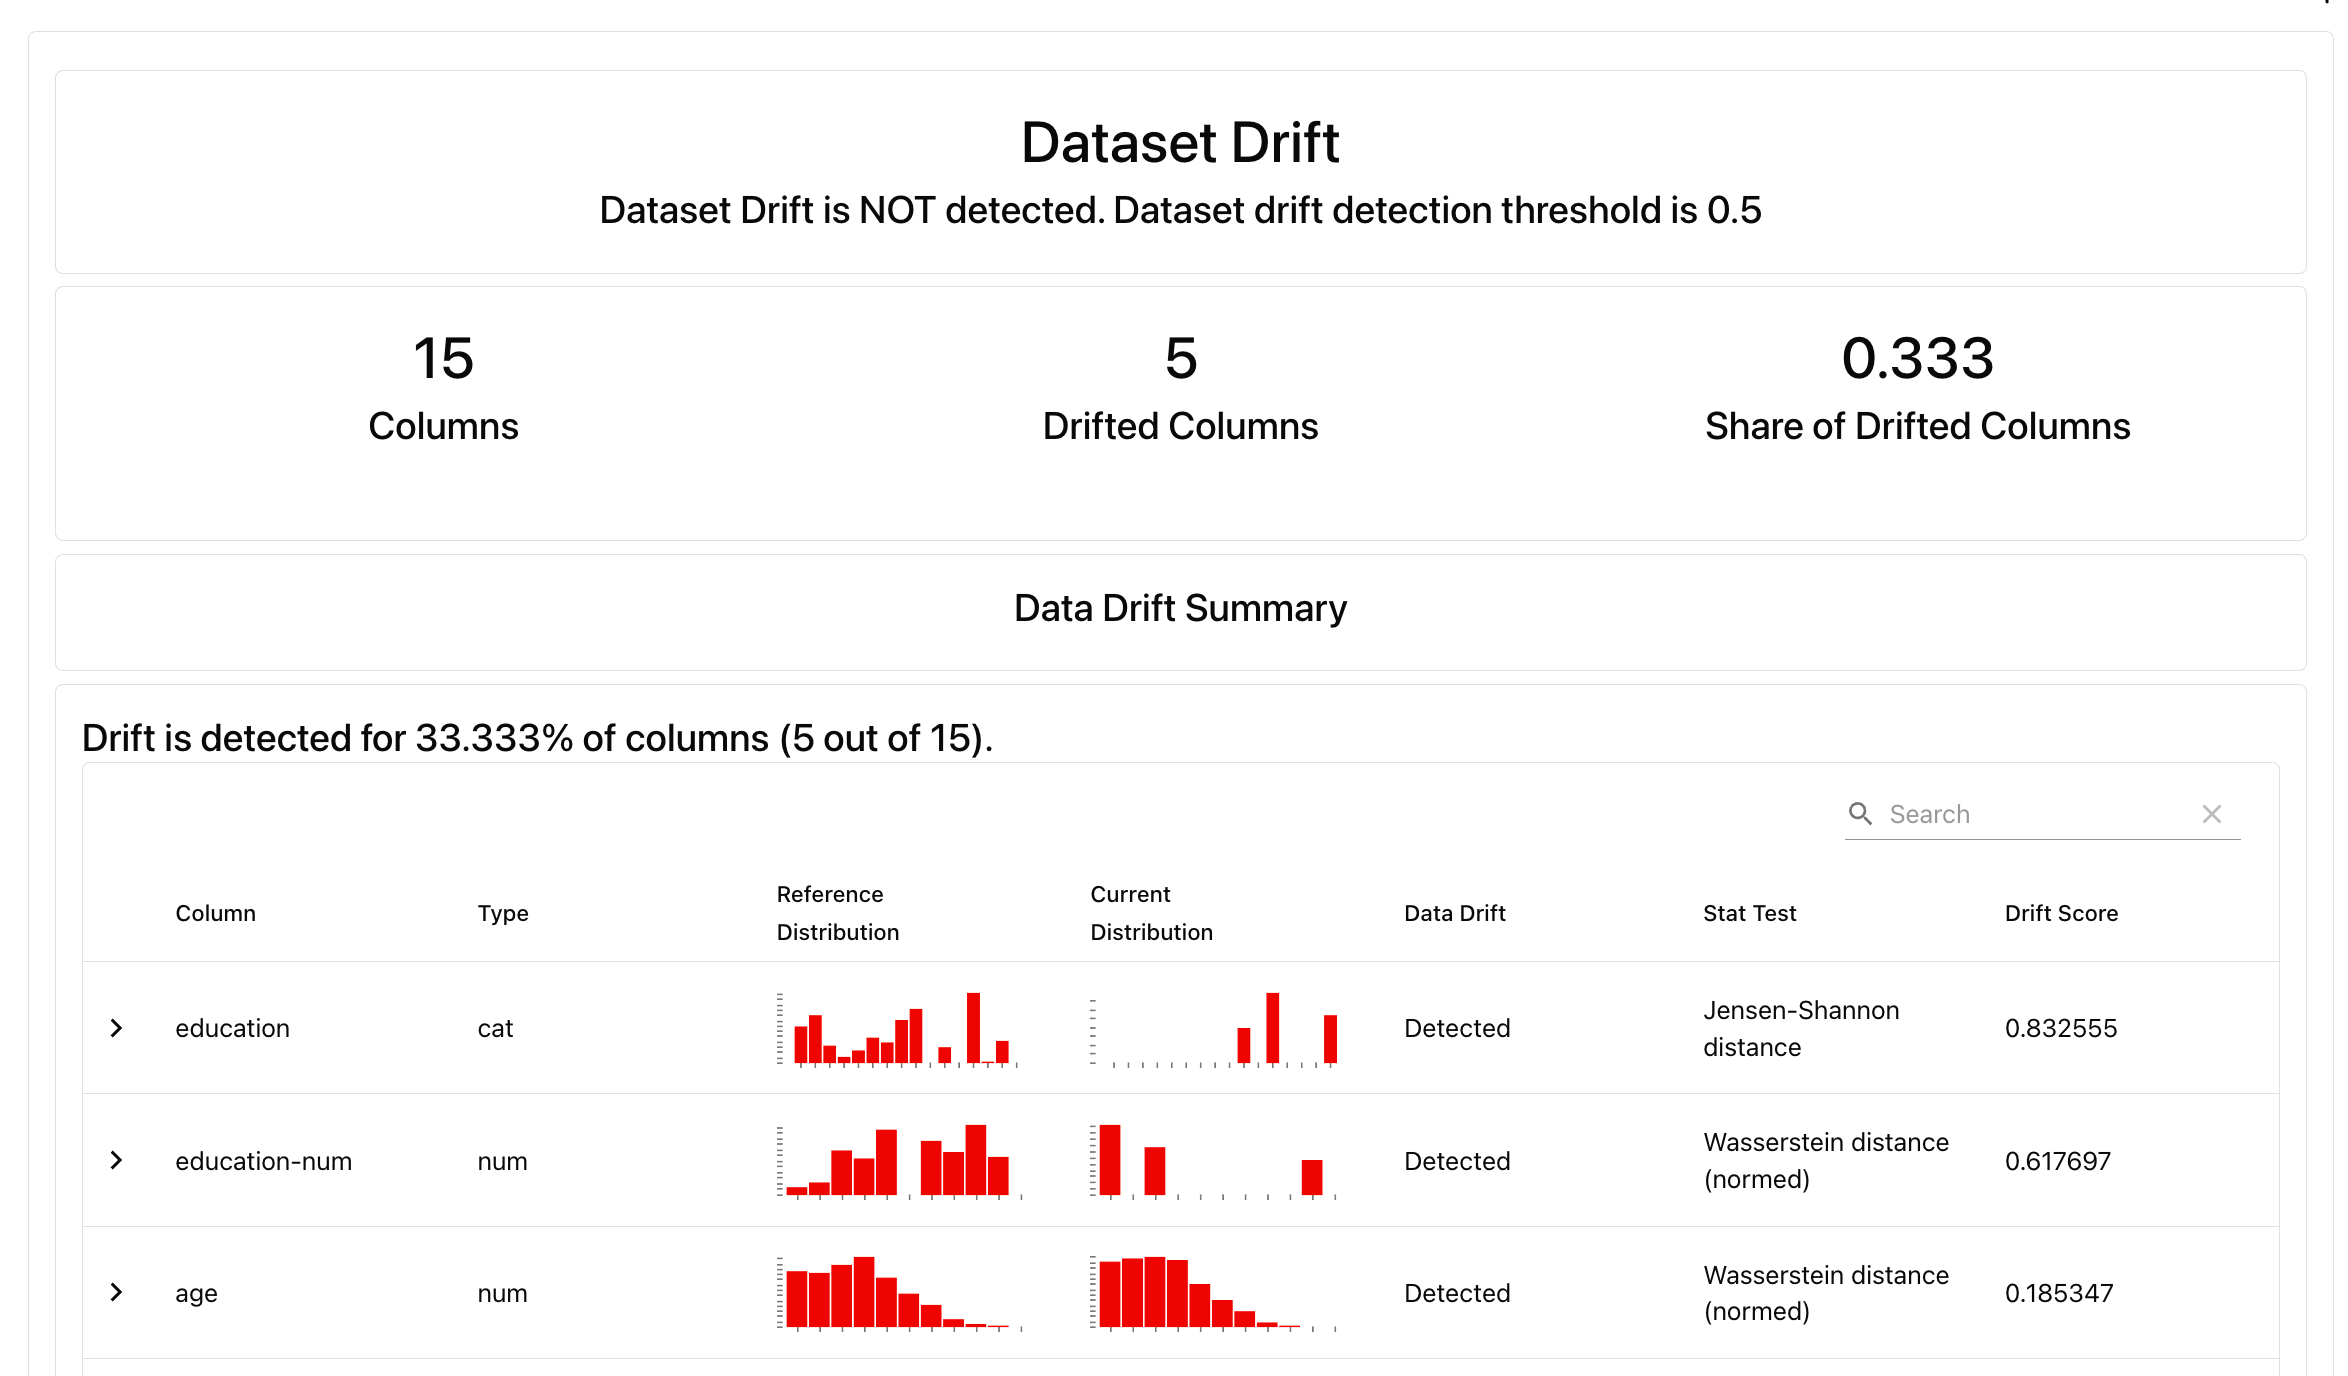
my_eval

This will render the Report directly in the notebook cell. You can also get a JSON or Python dictionary, or save as an external HTML file.

# my_eval.json()
# my_eval.dict()
# my_report.save_html(“file.html”)

Local Reports are great for one-off evaluations. To run continuous monitoring (e.g. track the share of drifting features over time), keep track of the results and collaborate with others, upload the results to Evidently Platform.

Upload the Report with summary results:

ws.add_run(project.id, my_eval, include_data=False)

View the Report. Go to Evidently Cloud, open your Project, navigate to “Reports” in the left and open the Report. You will see the summary with scores and Test results.

5. Get a Dashboard (Optional)

As you run repeated evals, you may want to track the results in time by creating a Dashboard. Evidently lets you configure the dashboard in the UI or using dashboards-as-code.

from evidently.sdk.models import PanelMetric
from evidently.sdk.panels import DashboardPanelPlot

project.dashboard.add_panel(
             DashboardPanelPlot(
                title="Dataset column drift",
                subtitle = "Share of drifted columns",
                size="half",
                values=[
                    PanelMetric(
                        legend="Share",
                        metric="DriftedColumnsCount",
                        metric_labels={"value_type": "share"} 
                    ),
                ],
                plot_params={"plot_type": "line"},
            ),
            tab="Data Drift",
        )
project.dashboard.add_panel(
             DashboardPanelPlot(
                title="Prediction drift",
                subtitle = """Drift in the prediction column ("class"), method: Jensen-Shannon distance""",
                size="half",
                values=[
                    PanelMetric(
                        legend="Drift score",
                        metric="ValueDrift",
                        metric_labels={"column": "class"} 
                    ),
                ],
                plot_params={"plot_type": "bar"},
            ),
            tab="Data Drift",
        )

This will result in the following Dashboard you’ll be able to access in the Dashboard tab (left menu).

For now, you will see only one datapoint, but as you add more Reports (e.g. daily or weekly), you’ll be able to track the results over time.

What’s next?

  • See available Evidently Metrics: All Metric Table
  • Understand how you can add conditional tests to your Reports: Tests.
  • Explore options for Dashboard design: Dashboards

Alternatively, try DataSummaryPreset that will generate a summary of all columns in the dataset, and run auto-generated Tests to check for data quality and core descriptive stats.

report = Report([
    DataSummaryPreset() 
],
include_tests="True")
my_eval = report.run(eval_data_1, eval_data_2)