At a glance
Evidently library covers 4 core workflows. You can these features together or standalone.1. AI/ML Evaluations
TL;DR: Lots of useful AI/ML/data metrics out of the box. Exportable as scores or visual reports.
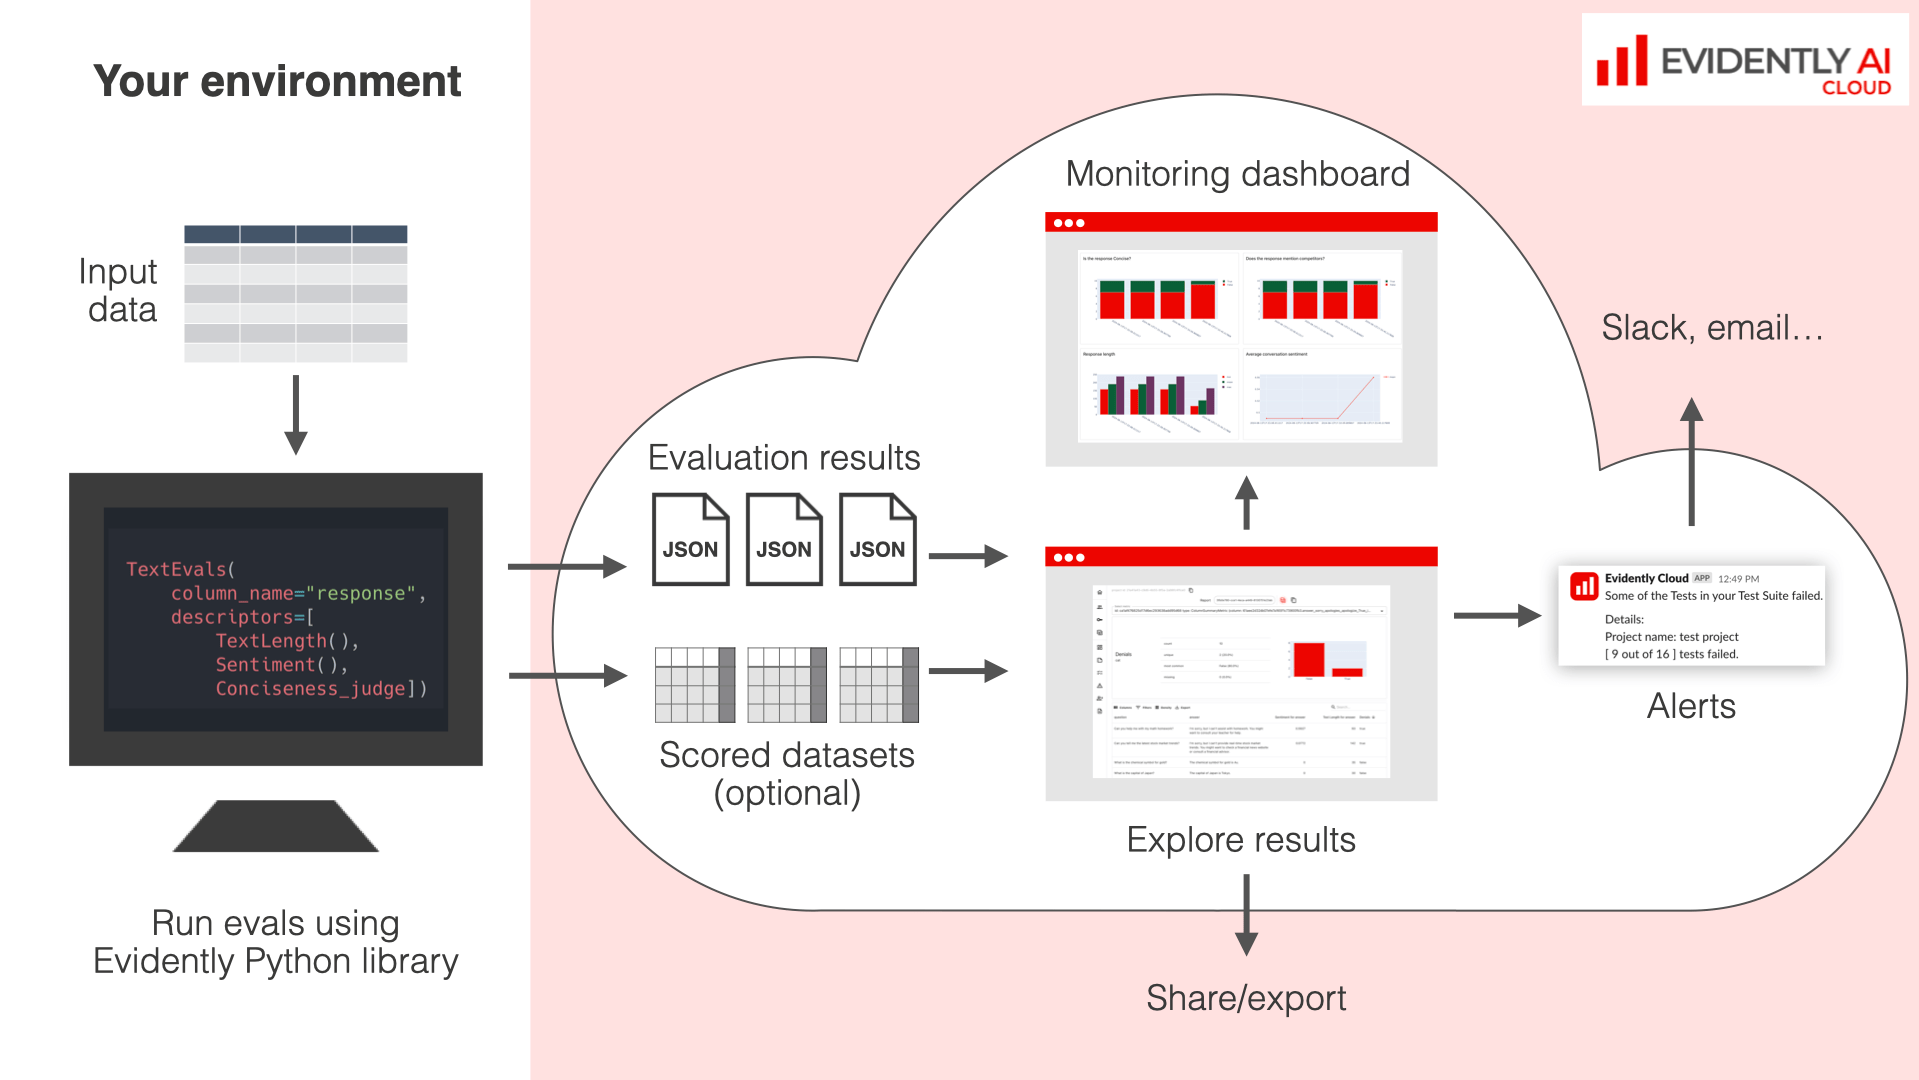
You can get evaluation results in multiple formats:
- Export scores as JSON or Python dictionary.
- As a DataFrame, either as a raw metrics table or by attaching scores to existing data rows.
- Generate visual reports in Jupyter, Colab, or export as HTML
- Upload to Evidently Platform to track evaluations over time
- Quickstart for LLM evaluation
- Quickstart for ML evaluation
2. Synthetic data generation [NEW]
TL;DR: We have a nice config for structured synthetic data generation using LLMs.
3. Prompt optimization [NEW]
TL;DR: We help write prompts using labeled or annotated data as a target.
4. Tracking and Visualization UI
TL;DR: There is also a minimal UI to store and track evaluation results.
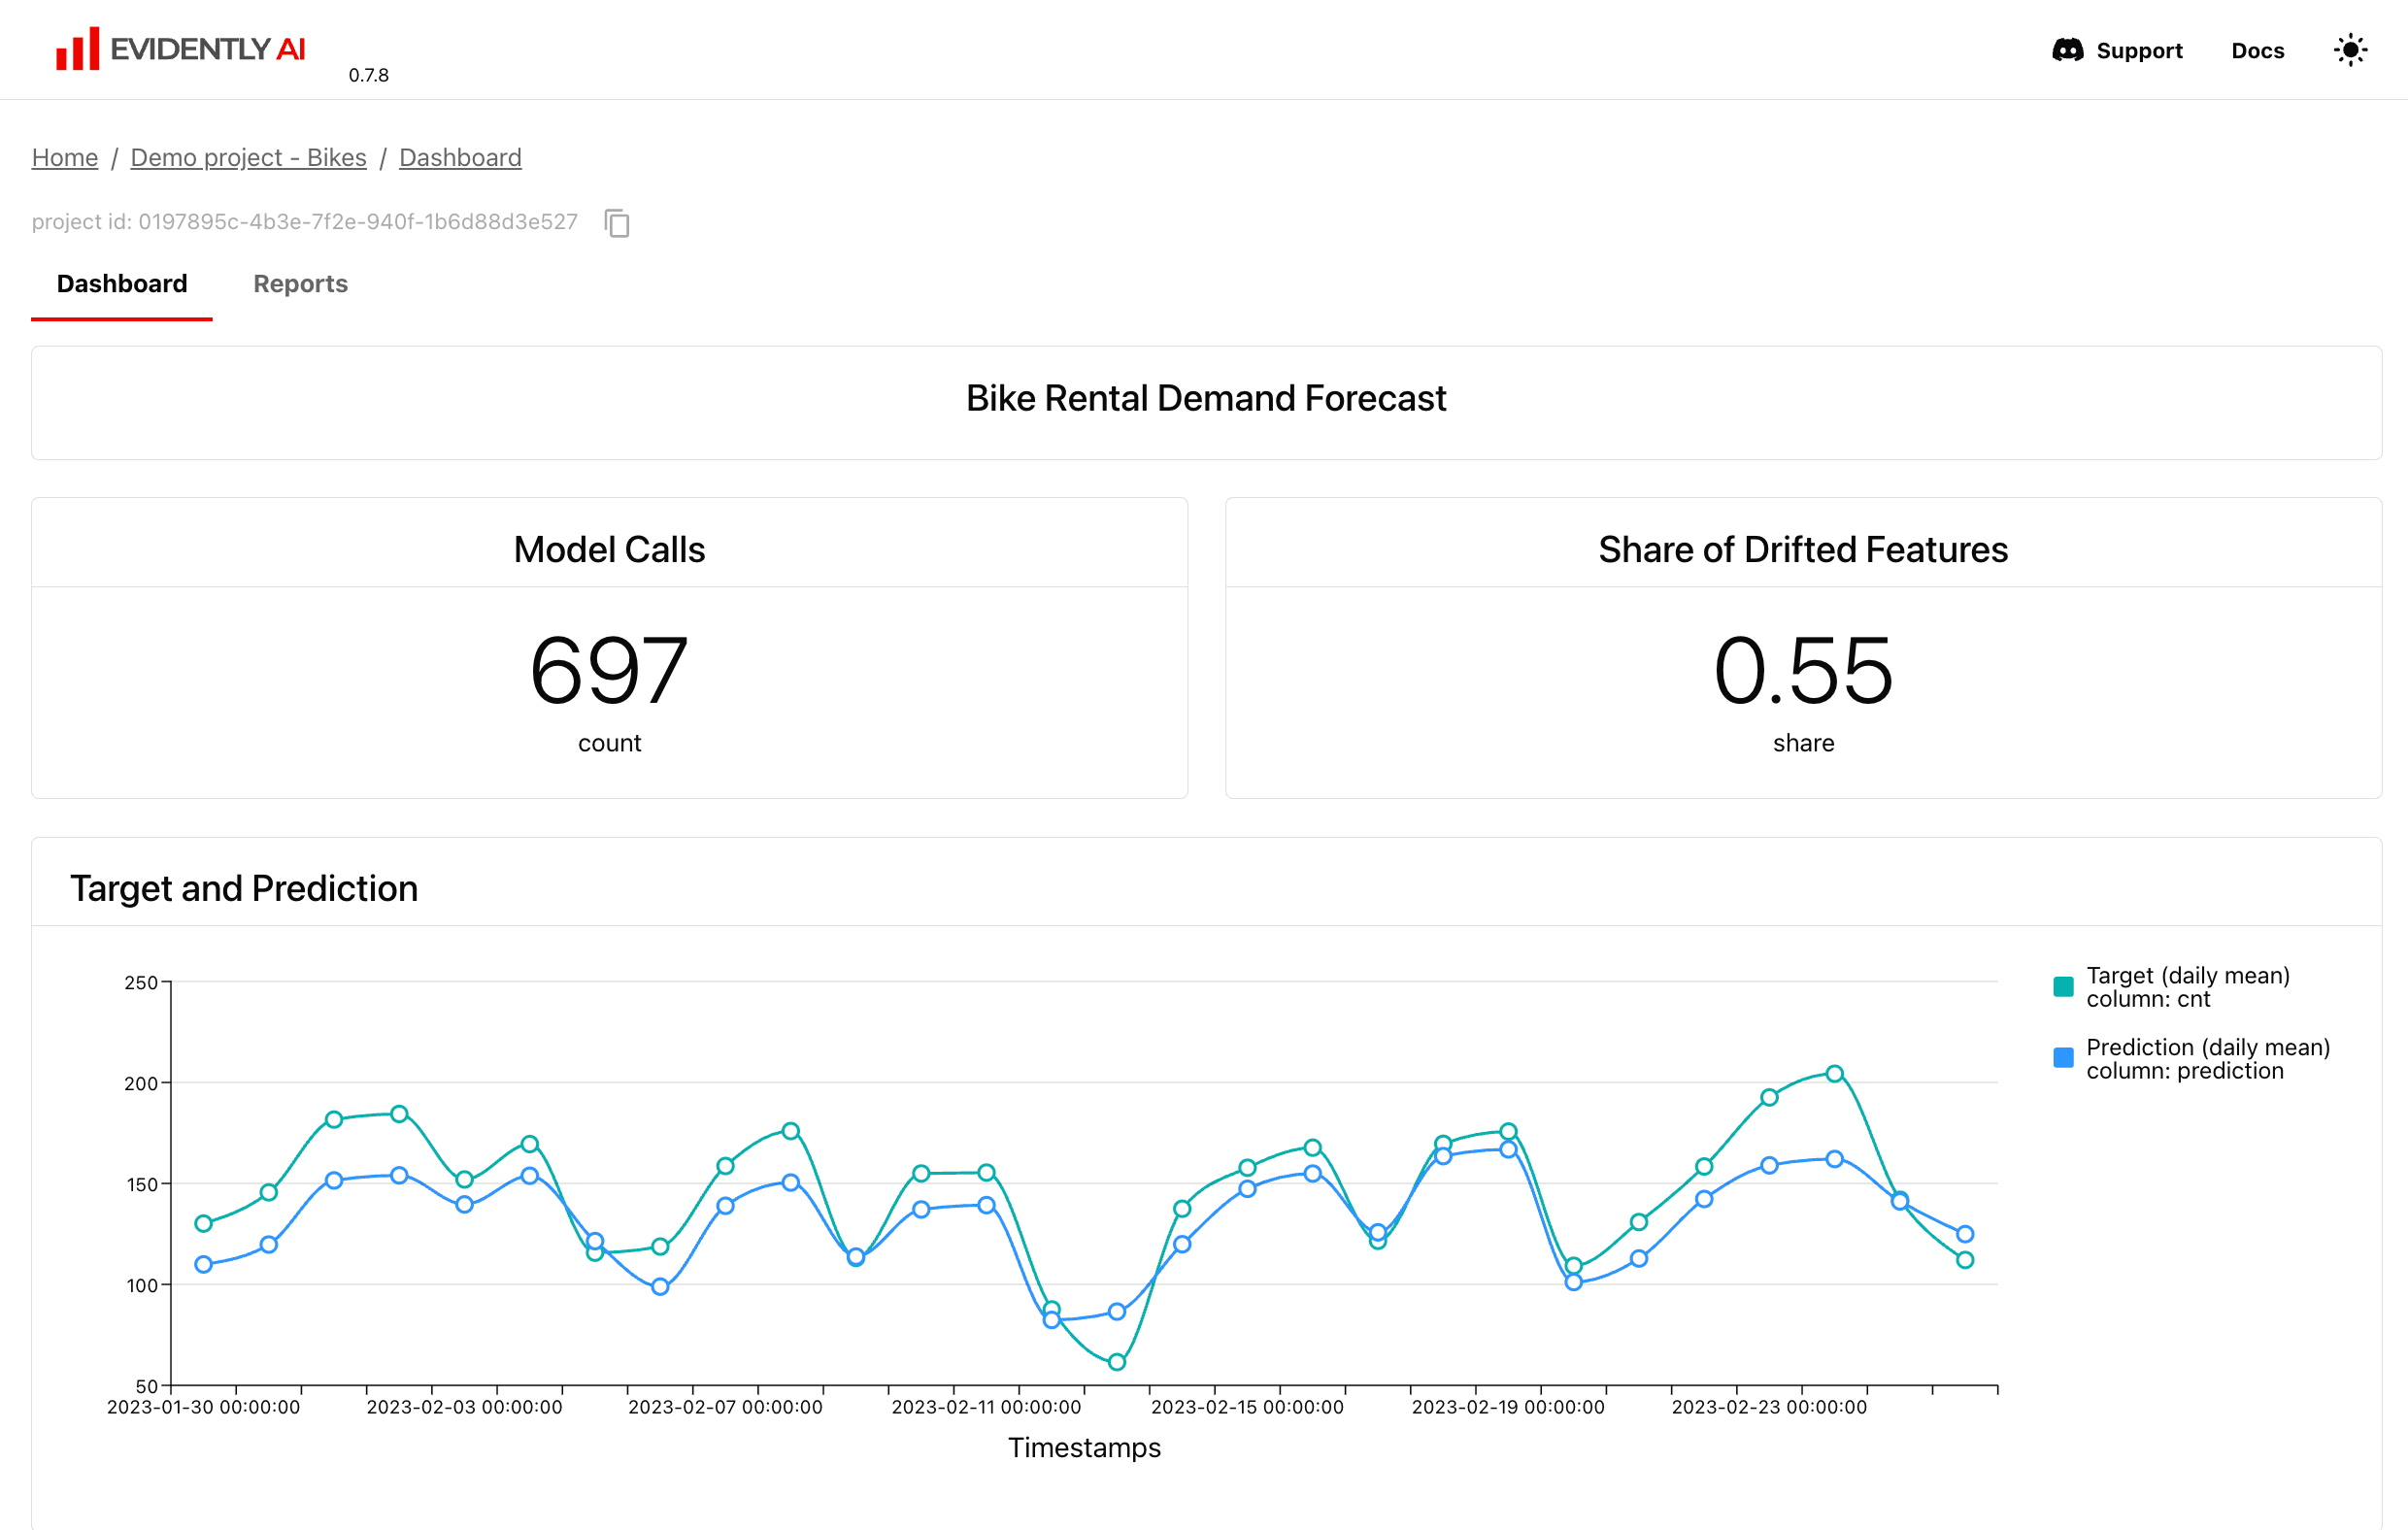
- See live demo: https://demo.evidentlyai.com.
- Self-hosting guide
The open-source UI is different from the Evidently Cloud / Enterprise platform version which has muliple additional features. Explore the Evidently Platform capabailities.
Core evaluation concepts
Let’s take a look at the end-to-end evaluation process. It can be adapted to different metrics or data types, following the same worklows.Dataset
To run an evaluation, you first need to prepare the data. For example, generate and trace outputs from your ML or LLM system.- Prepare your data as a pandas DataFrame. The table can include any combination of numerical, categorical, text, metadata (including timestamps or IDs), and embedding columns.
- LLM logs
- Data table
- Classification
- Regression
- Ranking
- Embeddings
LLM logs. Pass any text columns with inputs/outputs, context or ground truth.
- Create a Dataset object. Once you have the data, you must create an Evidently
Datasetobject. This allows attaching extra meta-information so that your data is processed correctly.
- [Optional] Preparing two datasets. Typically you evaluate a single (
current) dataset. Optionally, you can prepare a second (reference) dataset that will be used during the evaluation. Both must have identical structures.
- Side-by-side comparison. This lets you compare outputs or data quality across two periods, prompt/model versions, etc. in a single Report.
- Data drift detection. (Required). You can detect distribution shifts by comparing datasets, such as this week’s data to the previous one.
- Simplify test setup. You can automatically generate test conditions (e.g., min-max ranges) from the reference dataset without manual configuration.
Data sampling. For large datasets (millions of rows), evals can take some time. The depends on:
- the specific evaluation: some are more computationally intensive than others
- your dataset: e.g., if you run column-level evals and have lots of columns
- your infrastructure: data is processed in-memory.
Dataset is ready, you can run evaluations. You can either:
- Add
descriptorsto your dataset, and then compute a summary Report. - Compute a Report directly over raw data.
Descriptors
To evaluate text data and LLM outputs, you needDescriptors.
A Descriptor is a row-level score or label that assesses a specific quality of a given text. It’s different from metrics (like accuracy or precision) that give a score for an entire dataset. You can use descriptors to assess LLM outputs in summarization, Q&A, chatbots, agents, RAGs, etc.
Descriptors range from deterministic to complex ML- or LLM-based checks.
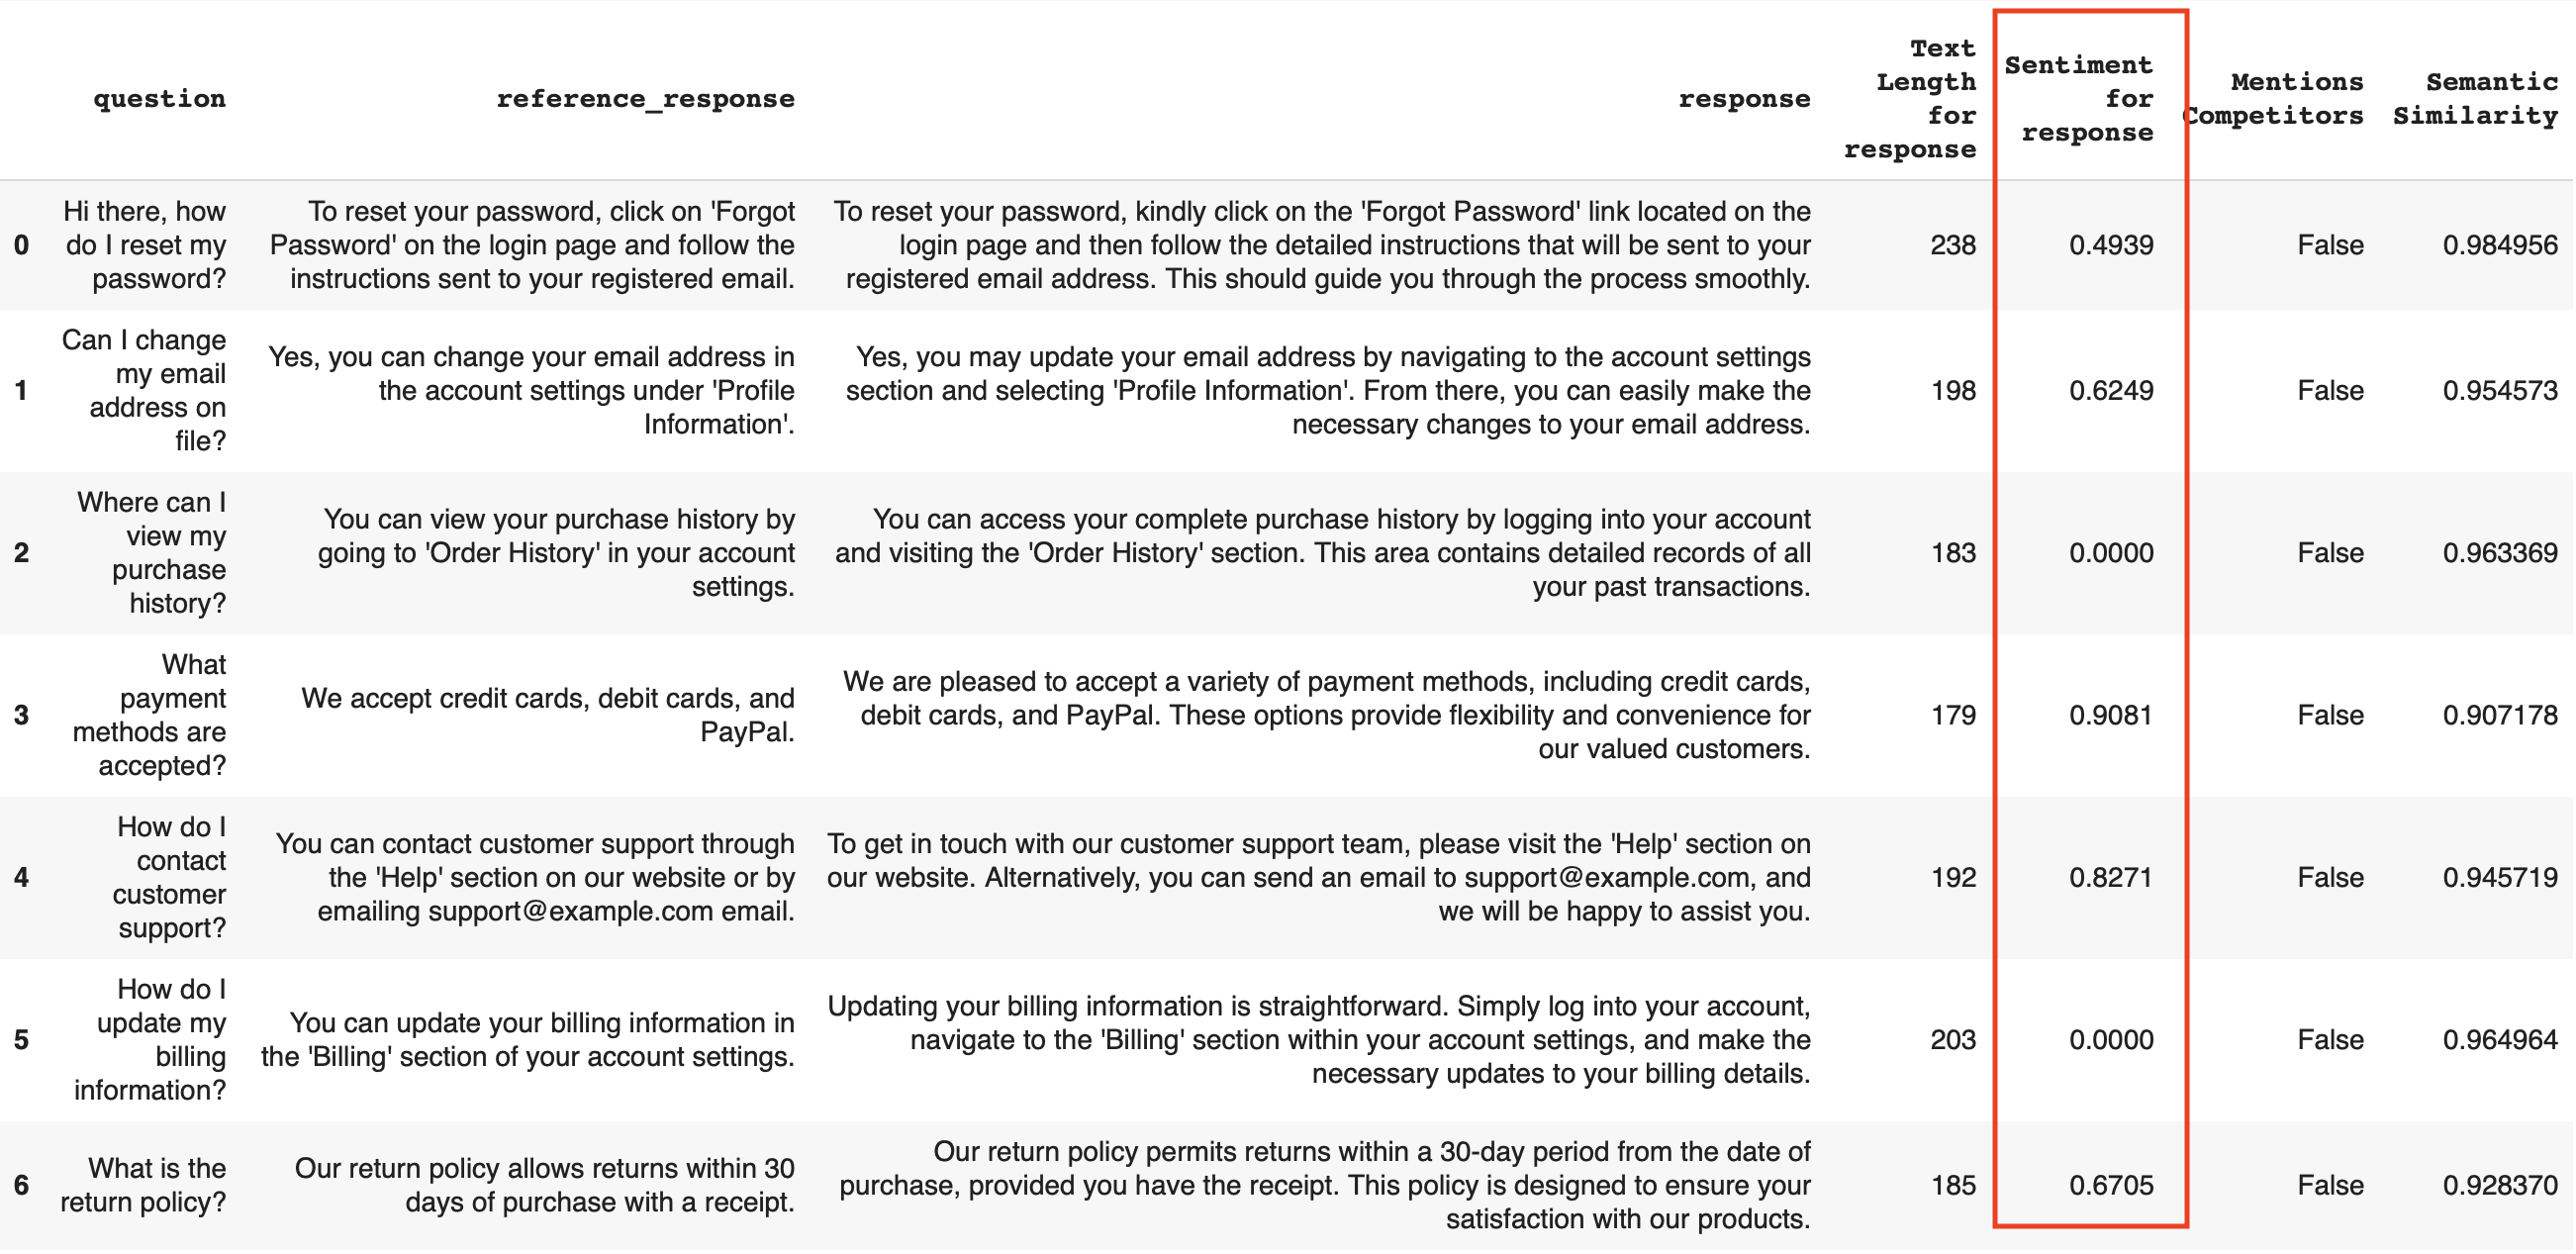
A simple example of a descriptor is TextLength. A more complex example is a customizable LLMEval descriptor: where you prompt an LLM to act as a judge and, for example, label responses as “relevant” or “not relevant”.
Descriptors can also use two texts at once, like checking SemanticSimilarity between two columns to compare new response to the reference one.
You can use built-in descriptors, configure templates (like LLM judges or regular expressions) or add custom checks in Python. Each Descriptor returns a result that can be:
- Numerical. Any scores like symbol count or sentiment score.
- Categorical. Labels or binary “true”/“false” results for pattern matches.
- Text string. Like explanations generated by LLM.
Reports
A Report lets you structure and run evals on the dataset or column-level. You can generate Reports after you get the descriptors, or for any existing dataset like a table with ML model logs. Use Reports to:- summarize the computed text descriptors across all inputs
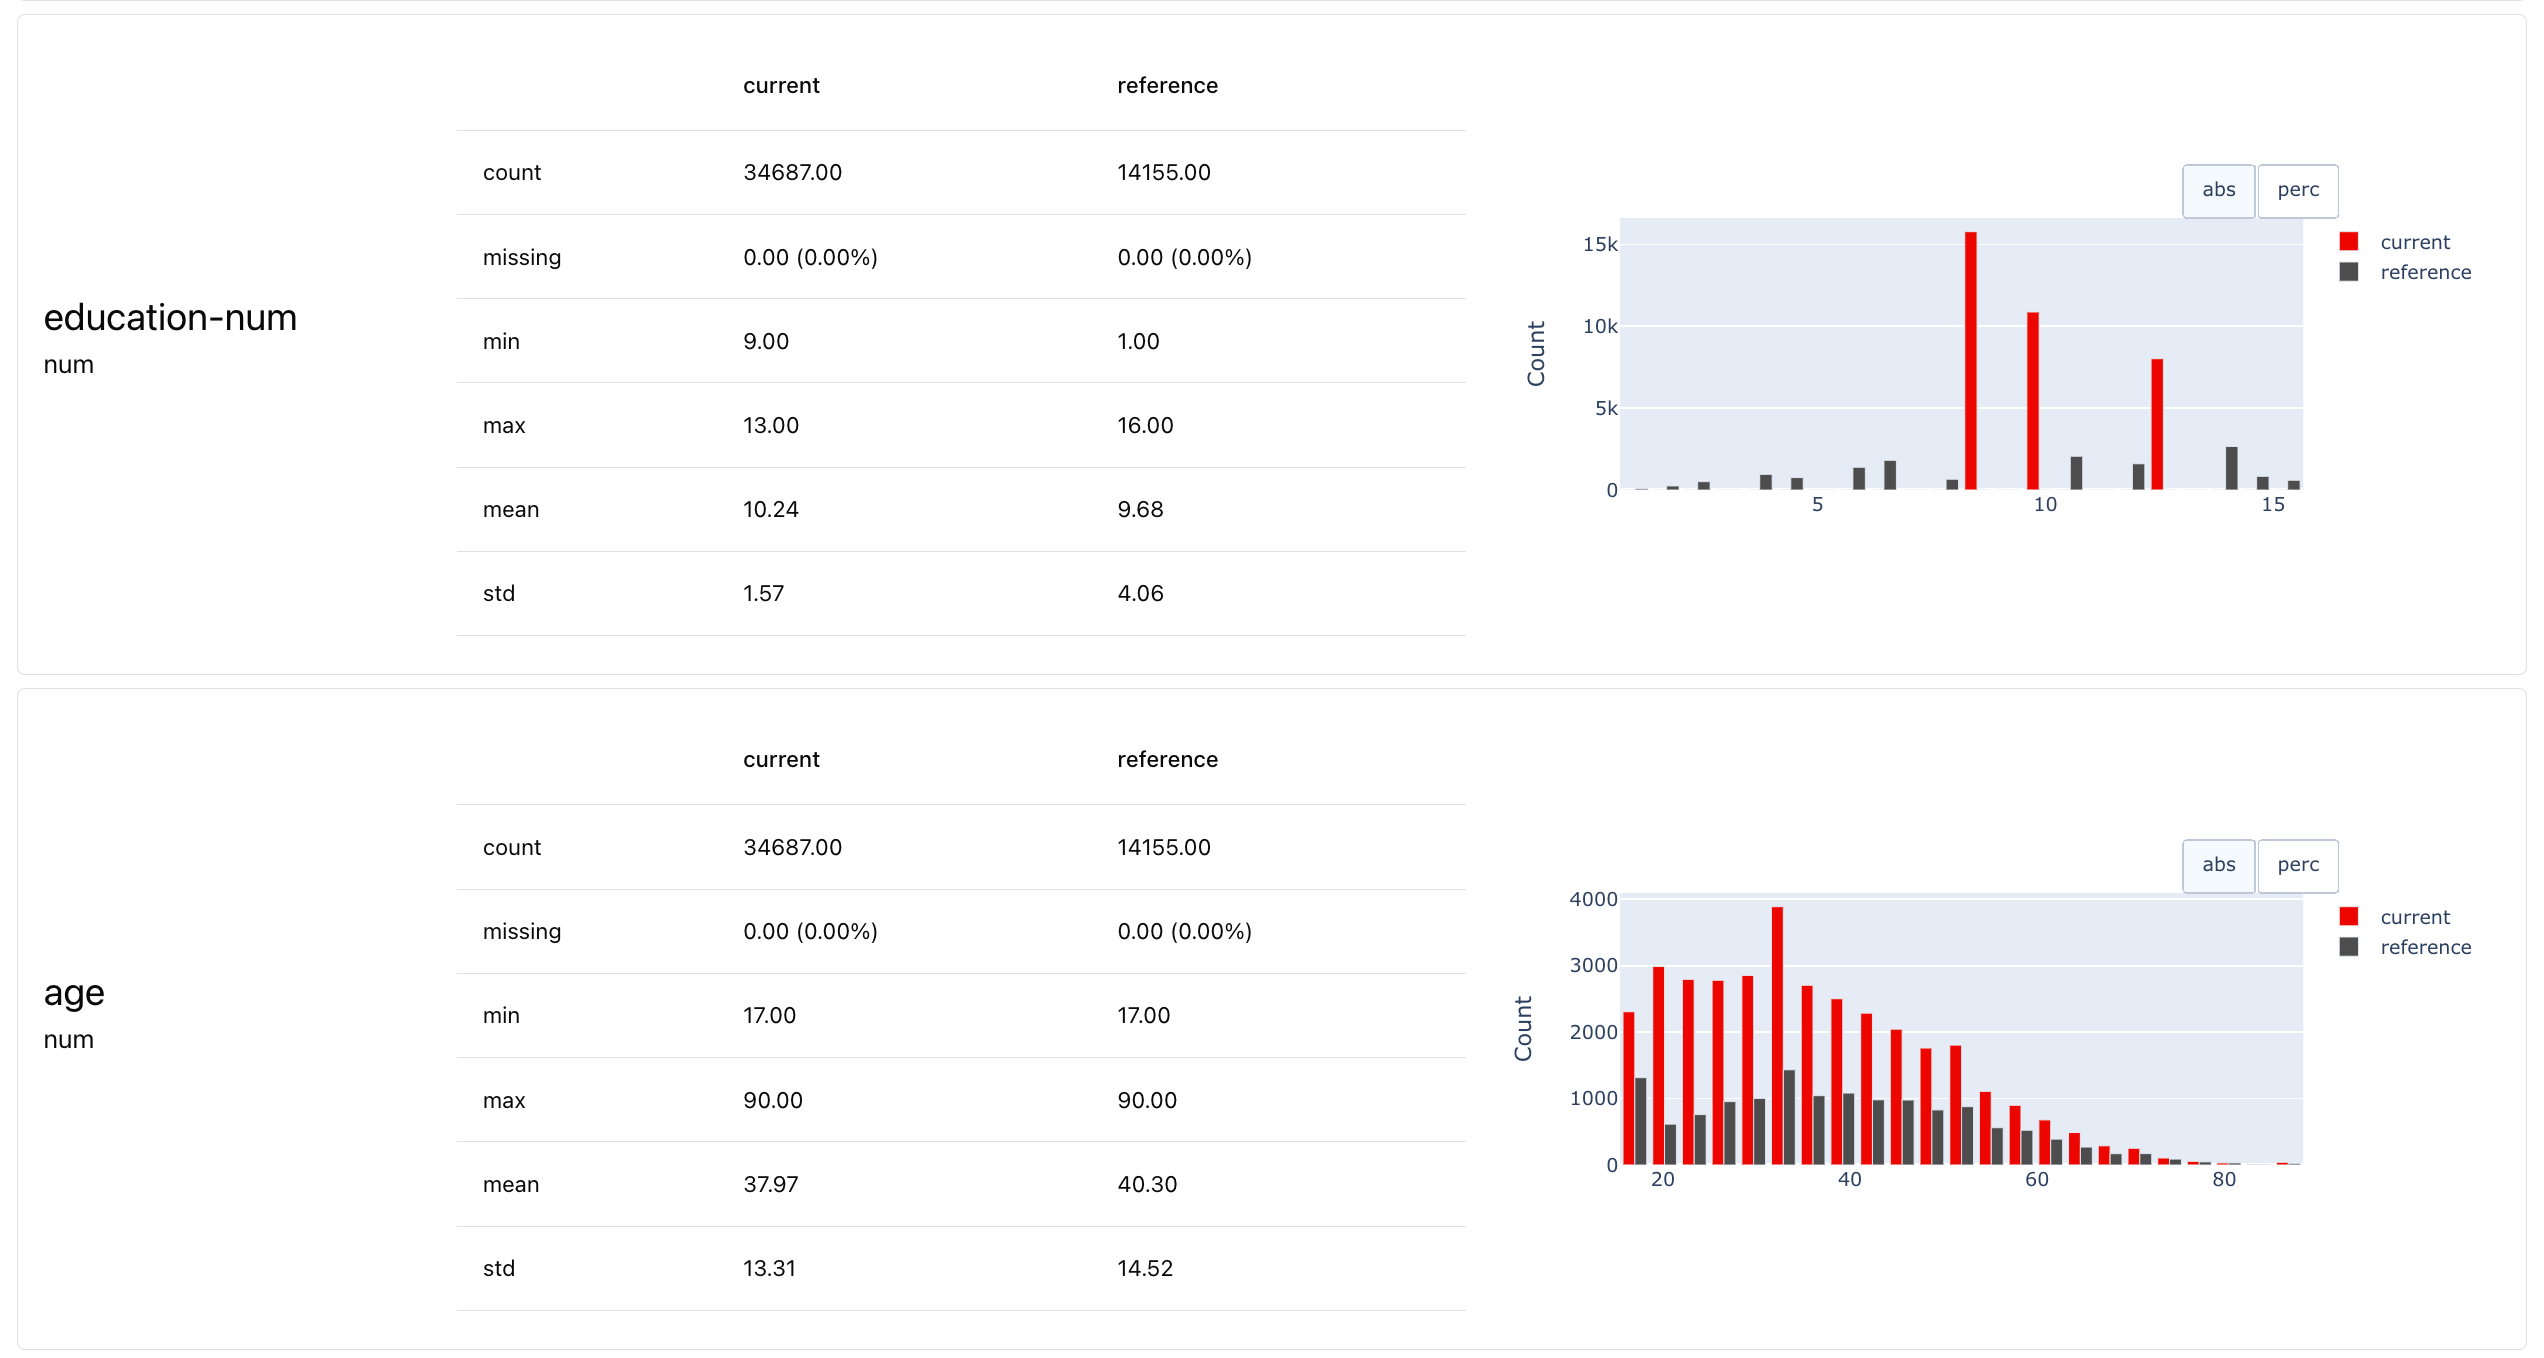
- analyze any tabular dataset (descriptive stats, quality, drift)
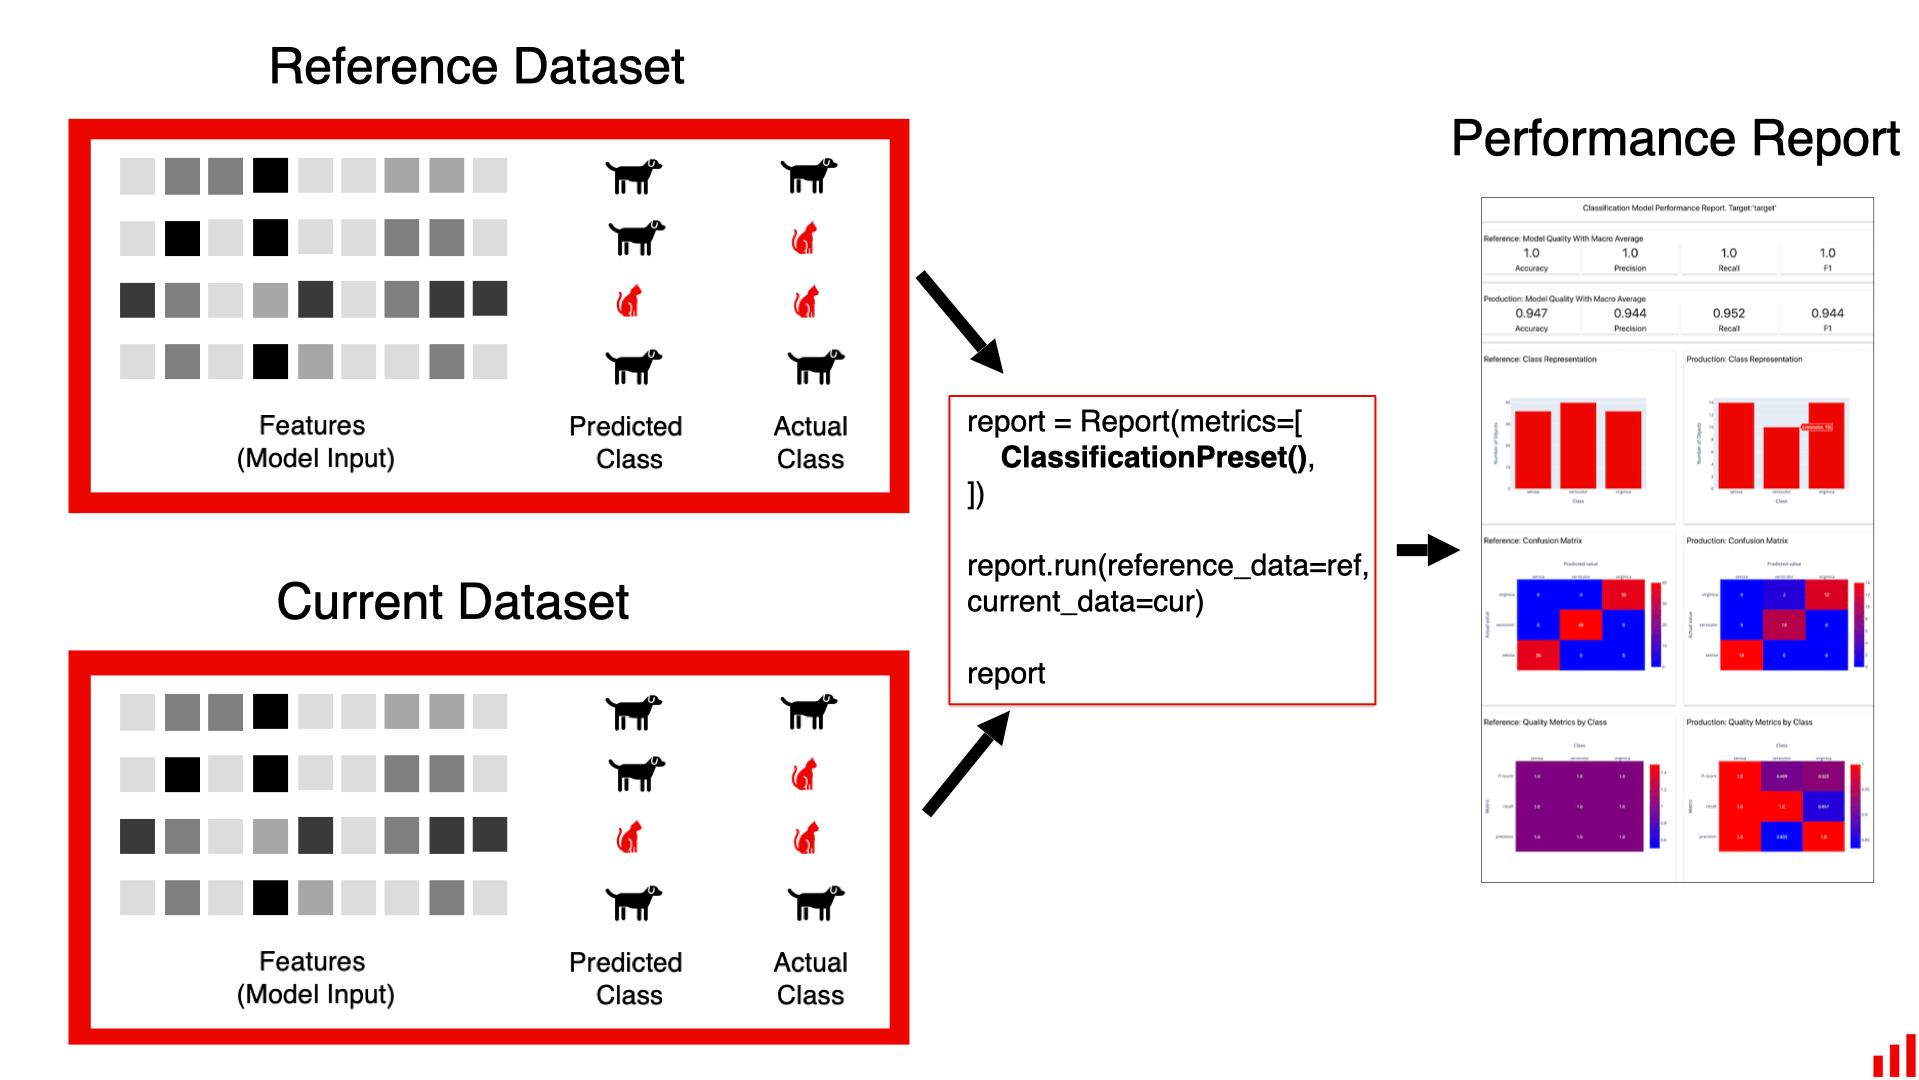
- evaluate AI system performance (regression, classification, ranking, etc.)
Metric Presets
Presets are pre-configured evaluation templates. They help compute multiple related Metrics using a single line of code. Evidently has a number of comprehensive Presets (see all) for specific evaluation scenarios: from exploratory data analysis to AI quality assessments. For example:- TextEvals
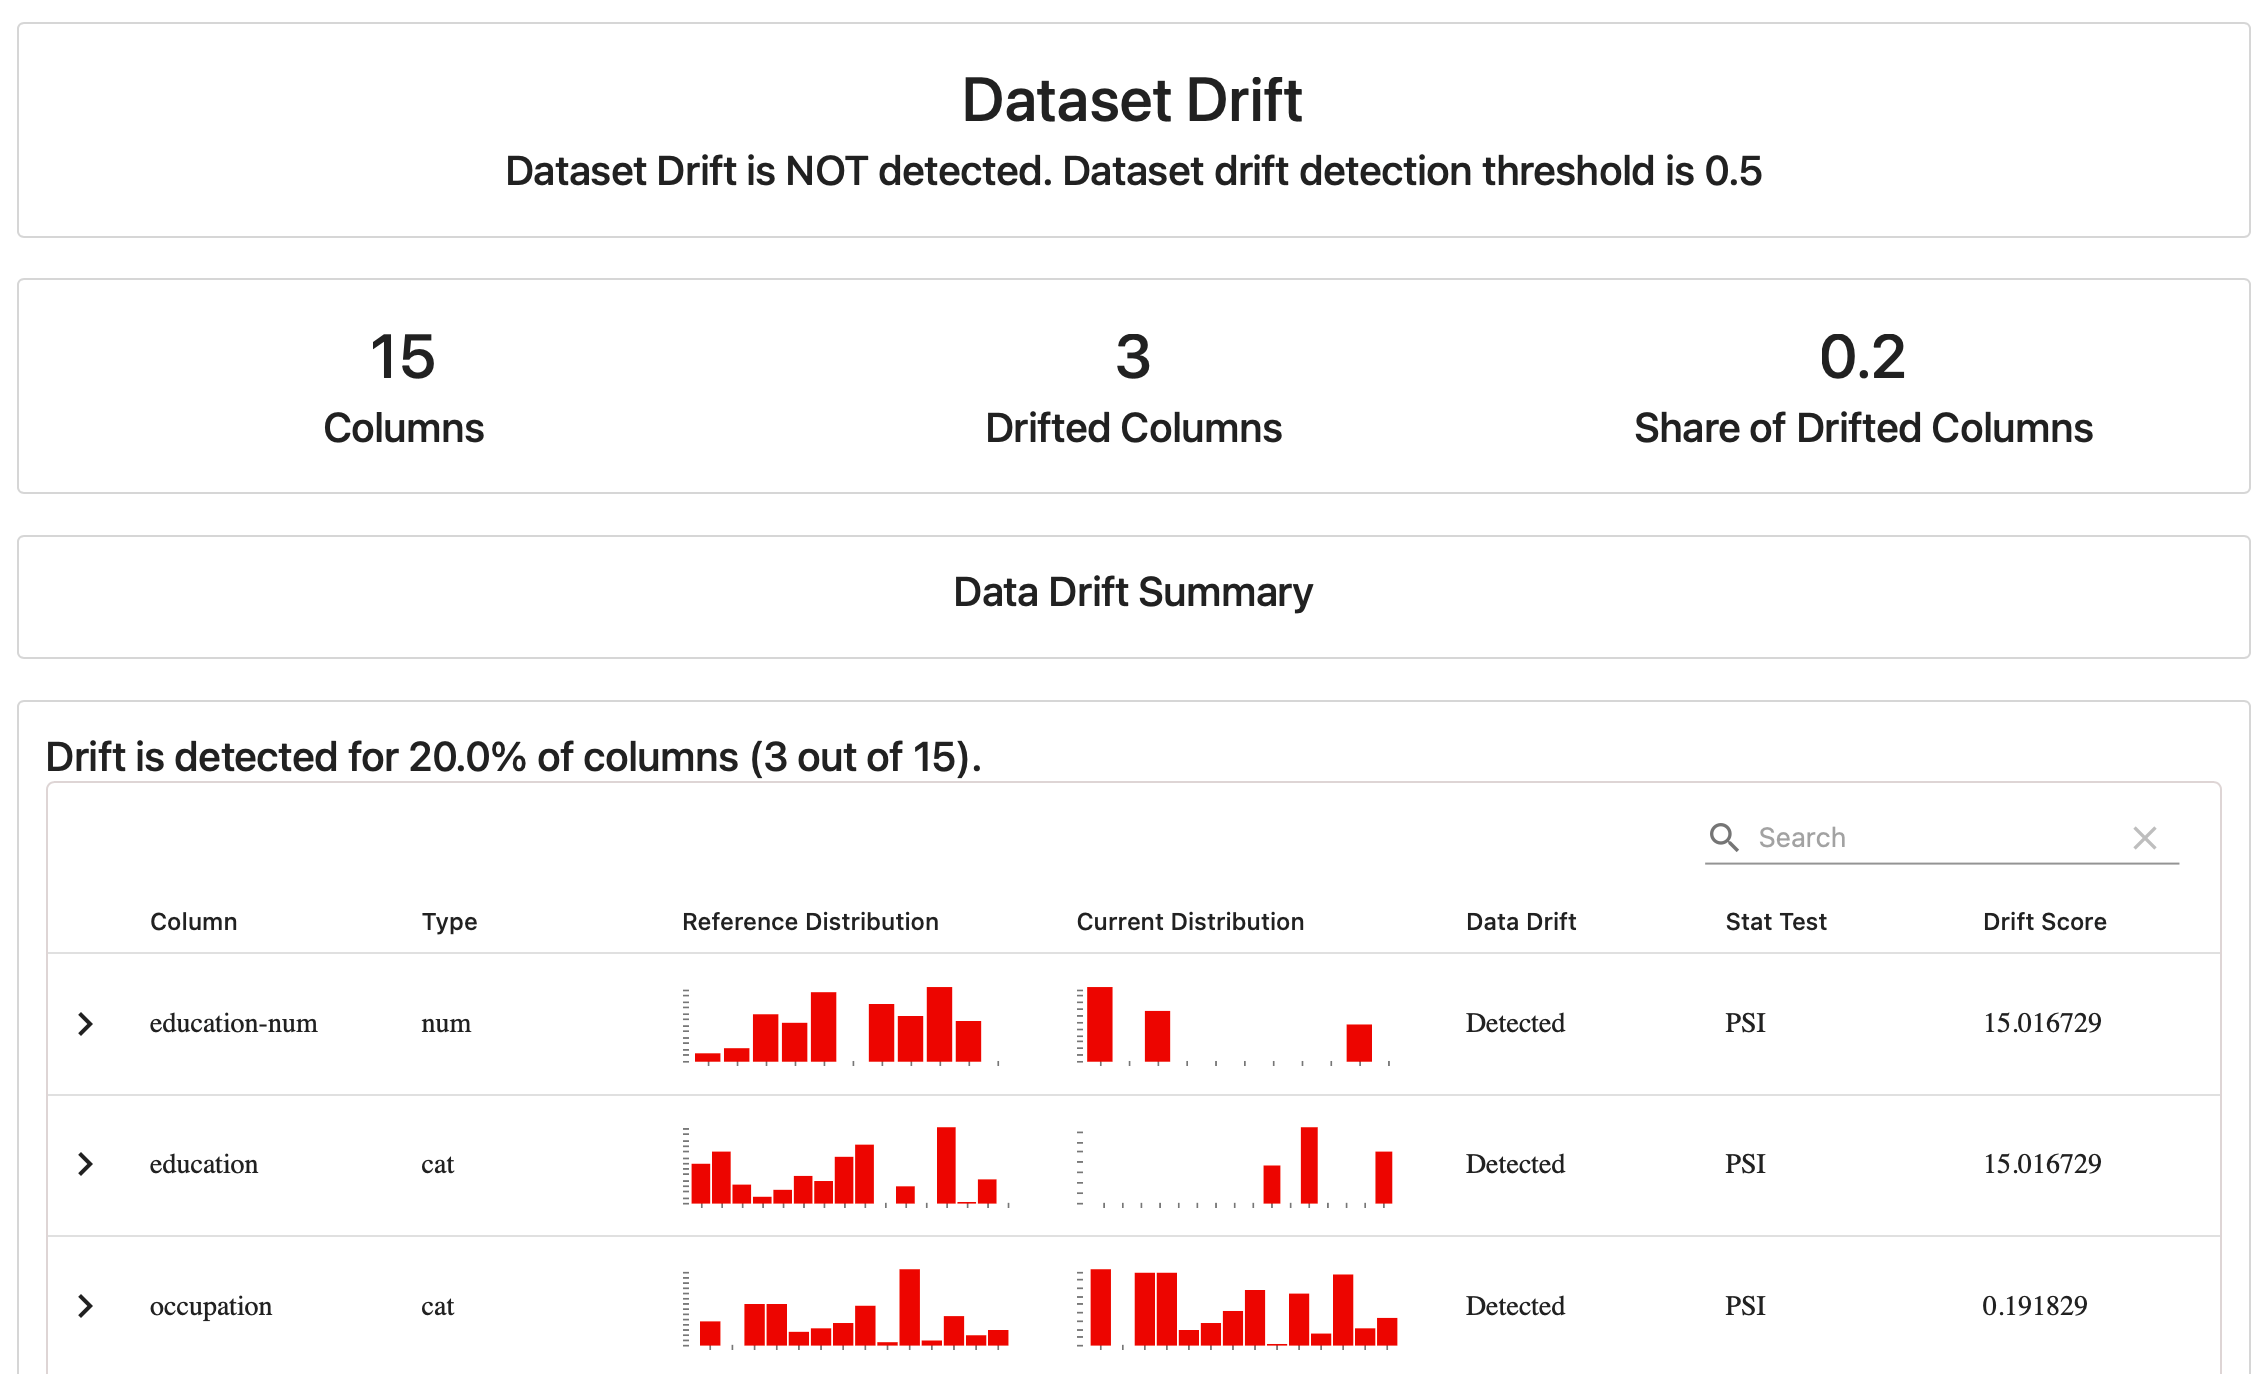
- Data Drift
- Data Summary
- Classification
TextEvals summarizes the scores from all text descriptors.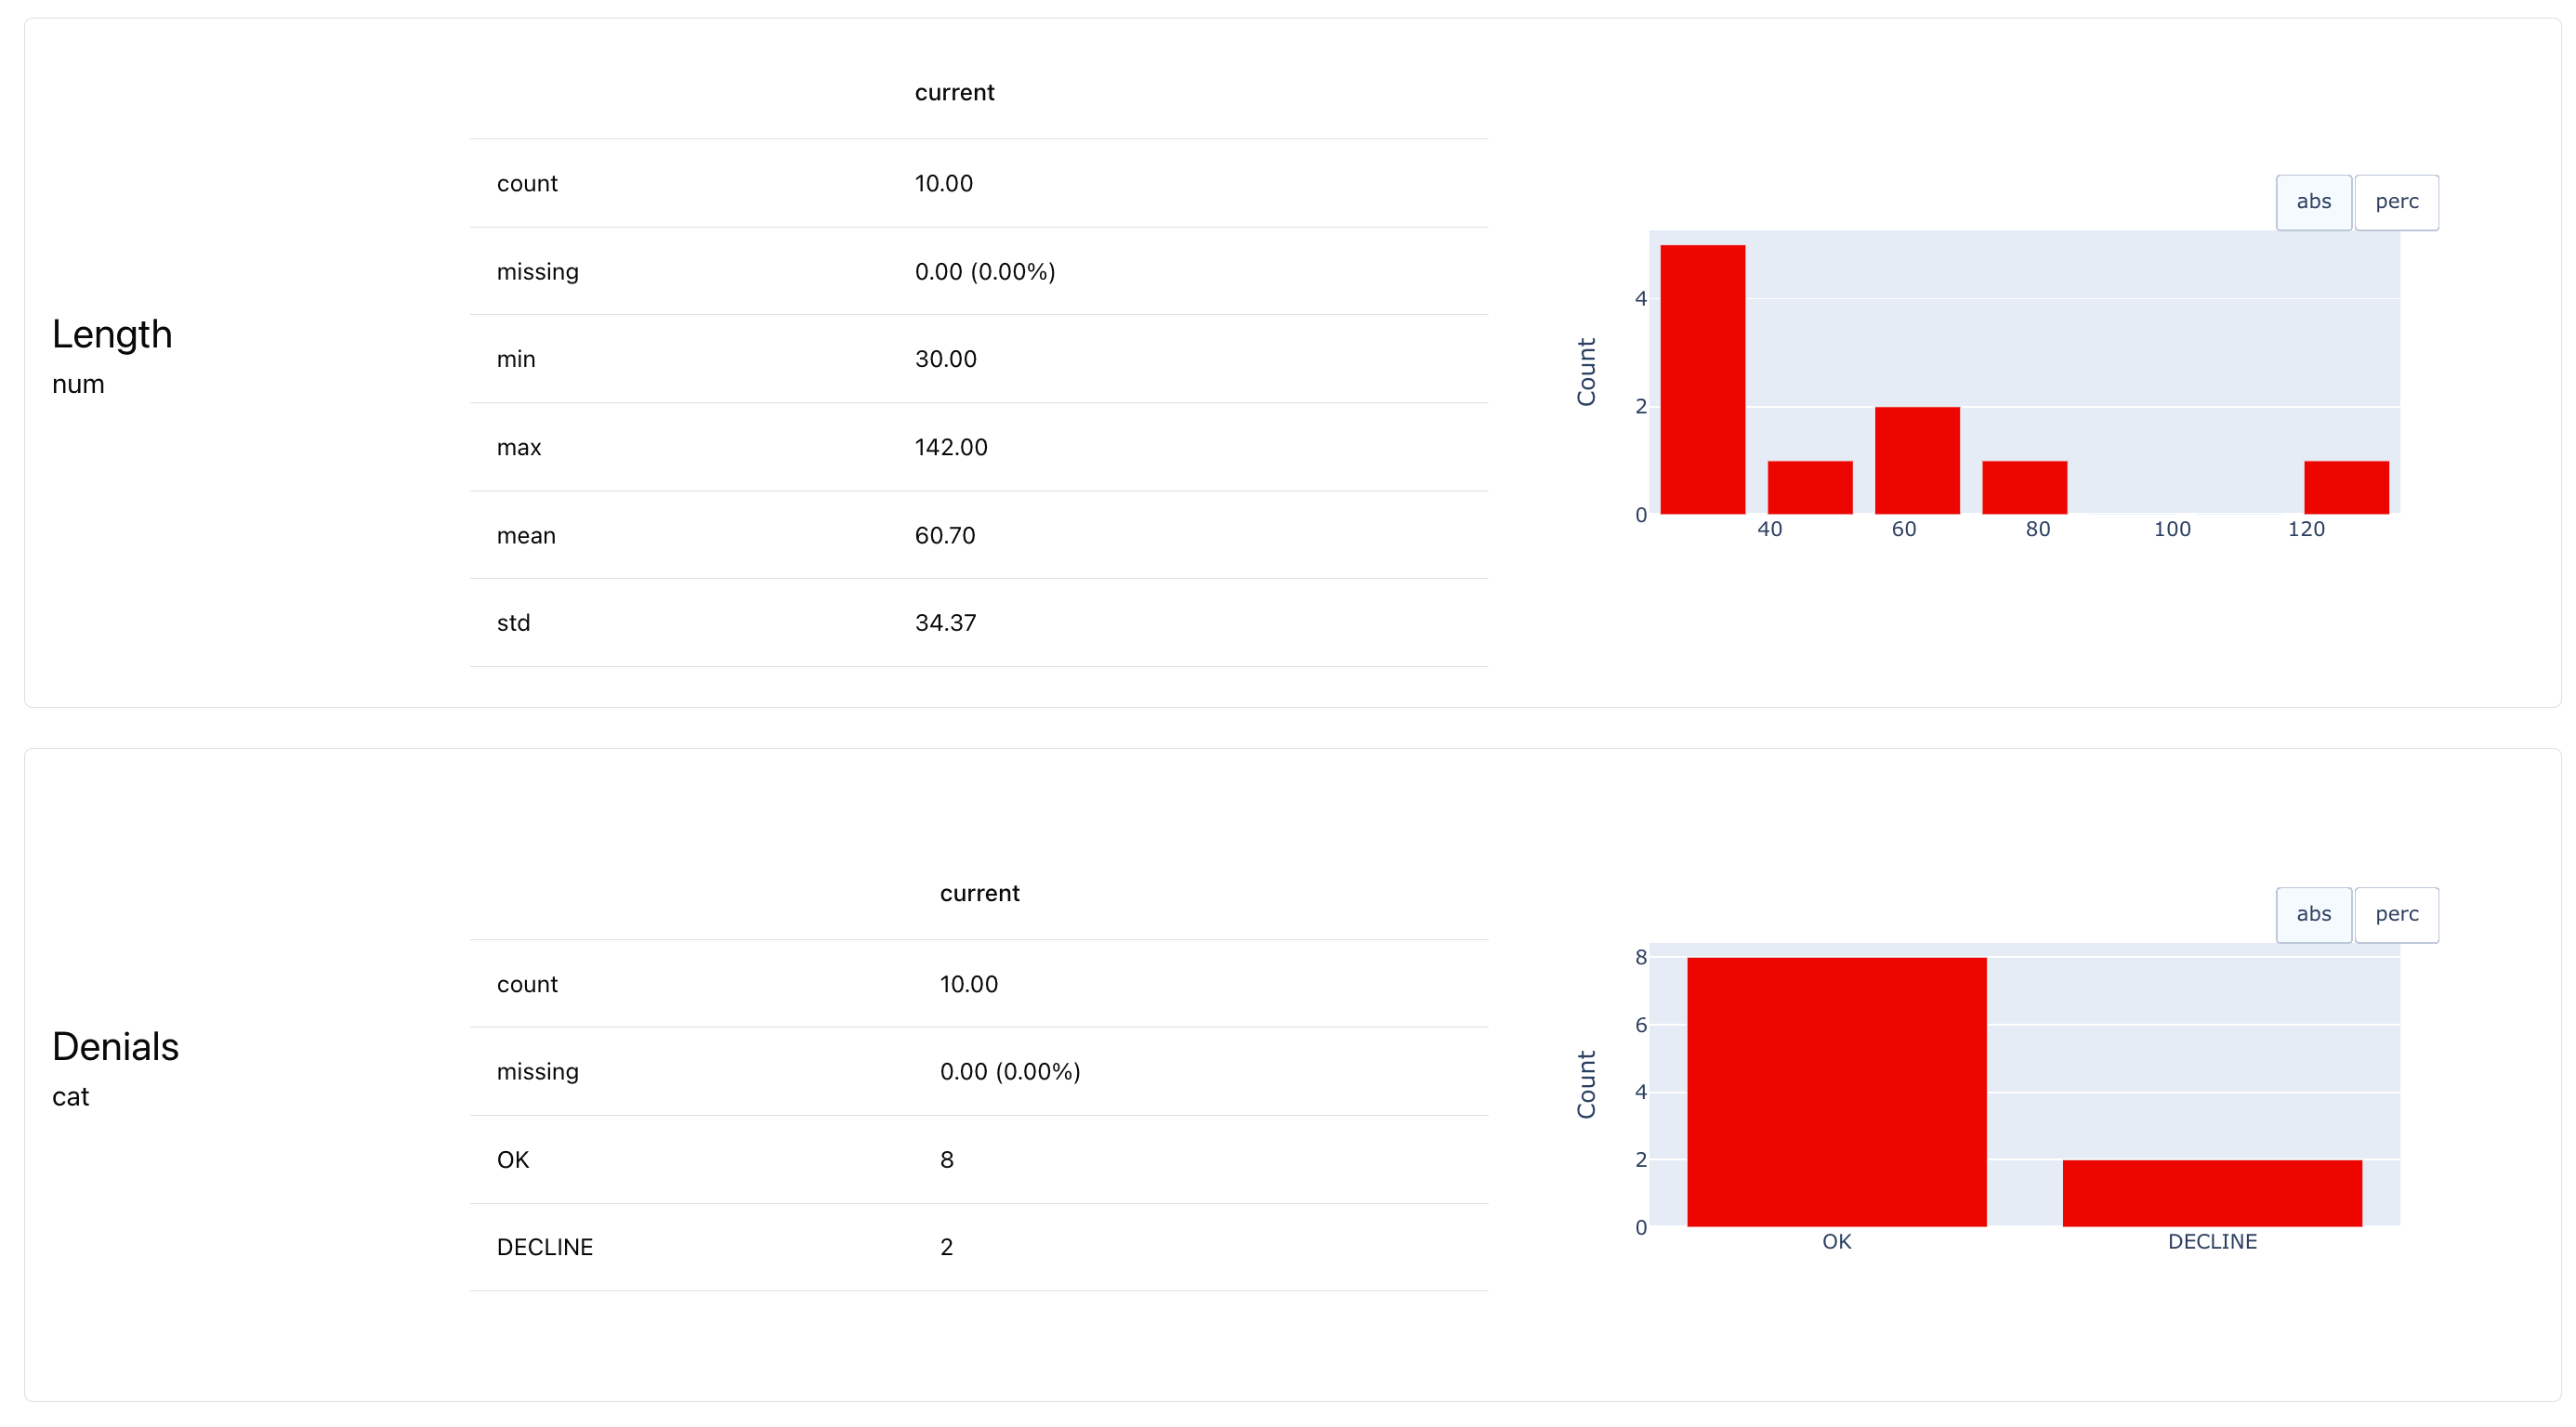
Metrics
Each Preset is made of individual Metrics. You can also create your own custom Report by listing theMetrics you want to include.
- You can combine multiple Metrics and Presets in a Report.
- You can include both built-in Metrics and custom Metrics.
MeanValue or MissingValueCount to complex algorithmic evals like DriftedColumnsCount.
Each Metric computes a single value and has an optional visual representation (or several to choose from). For convenience, there are also small Presets that combine a handful of scores in a single widget, like ValueStats that shows many relevant descriptive value statistics at once.
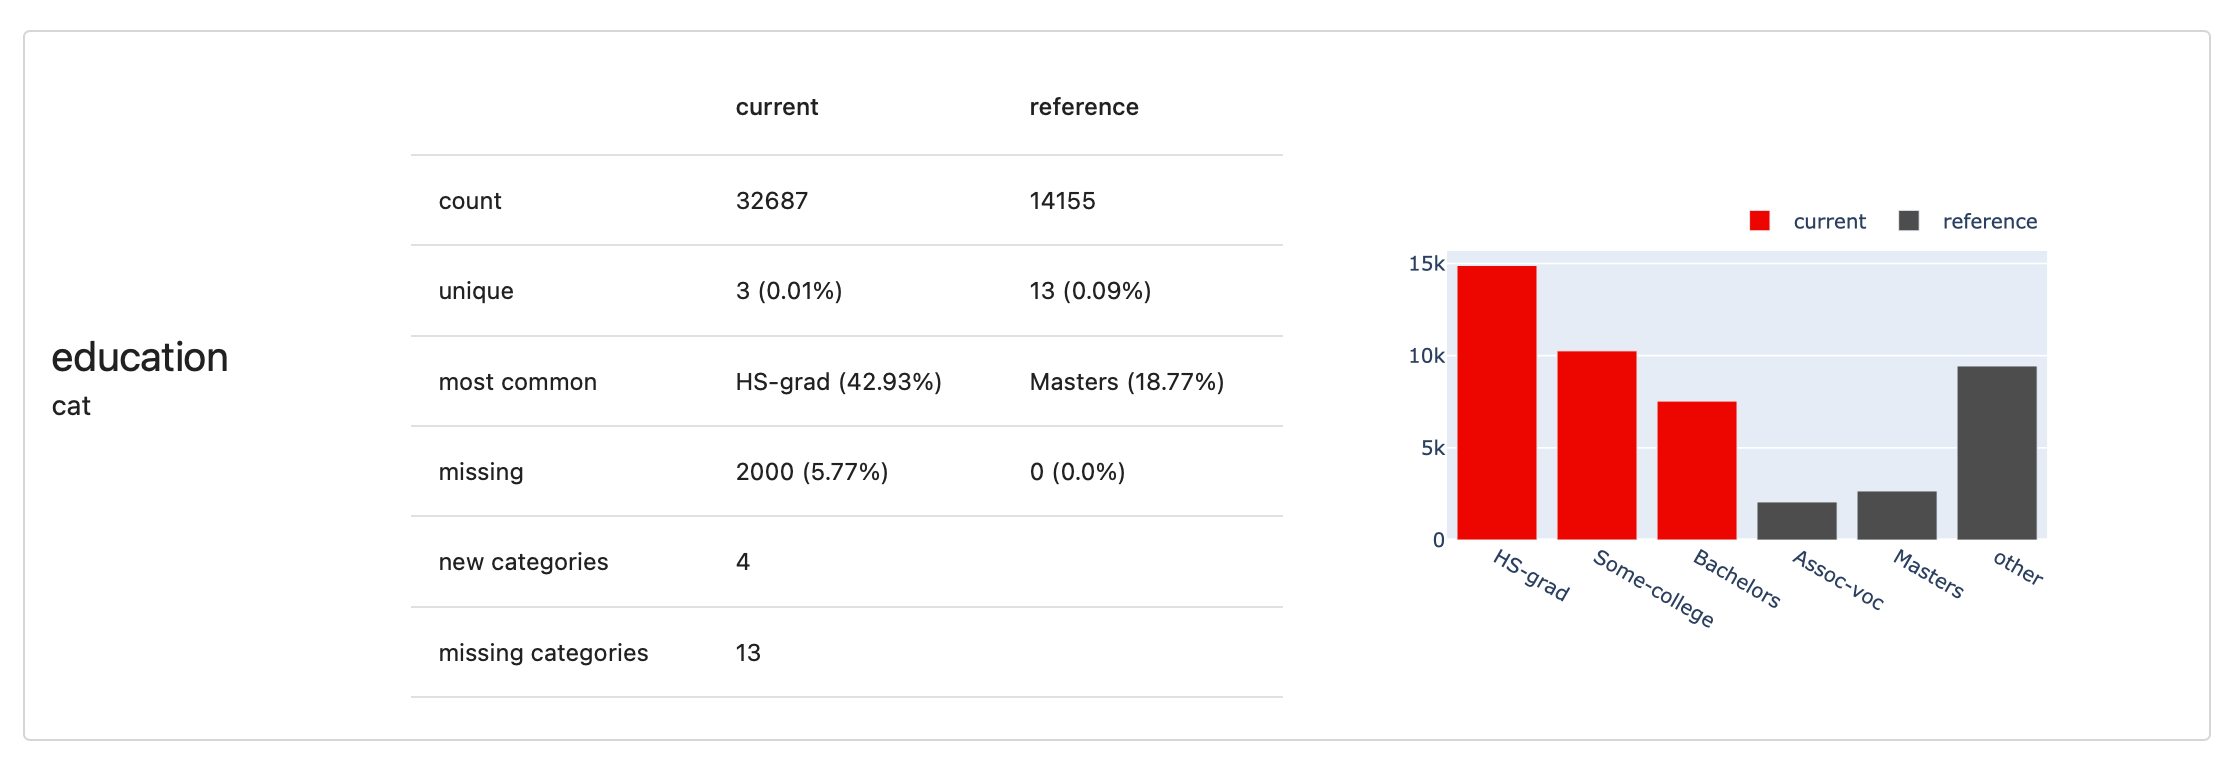
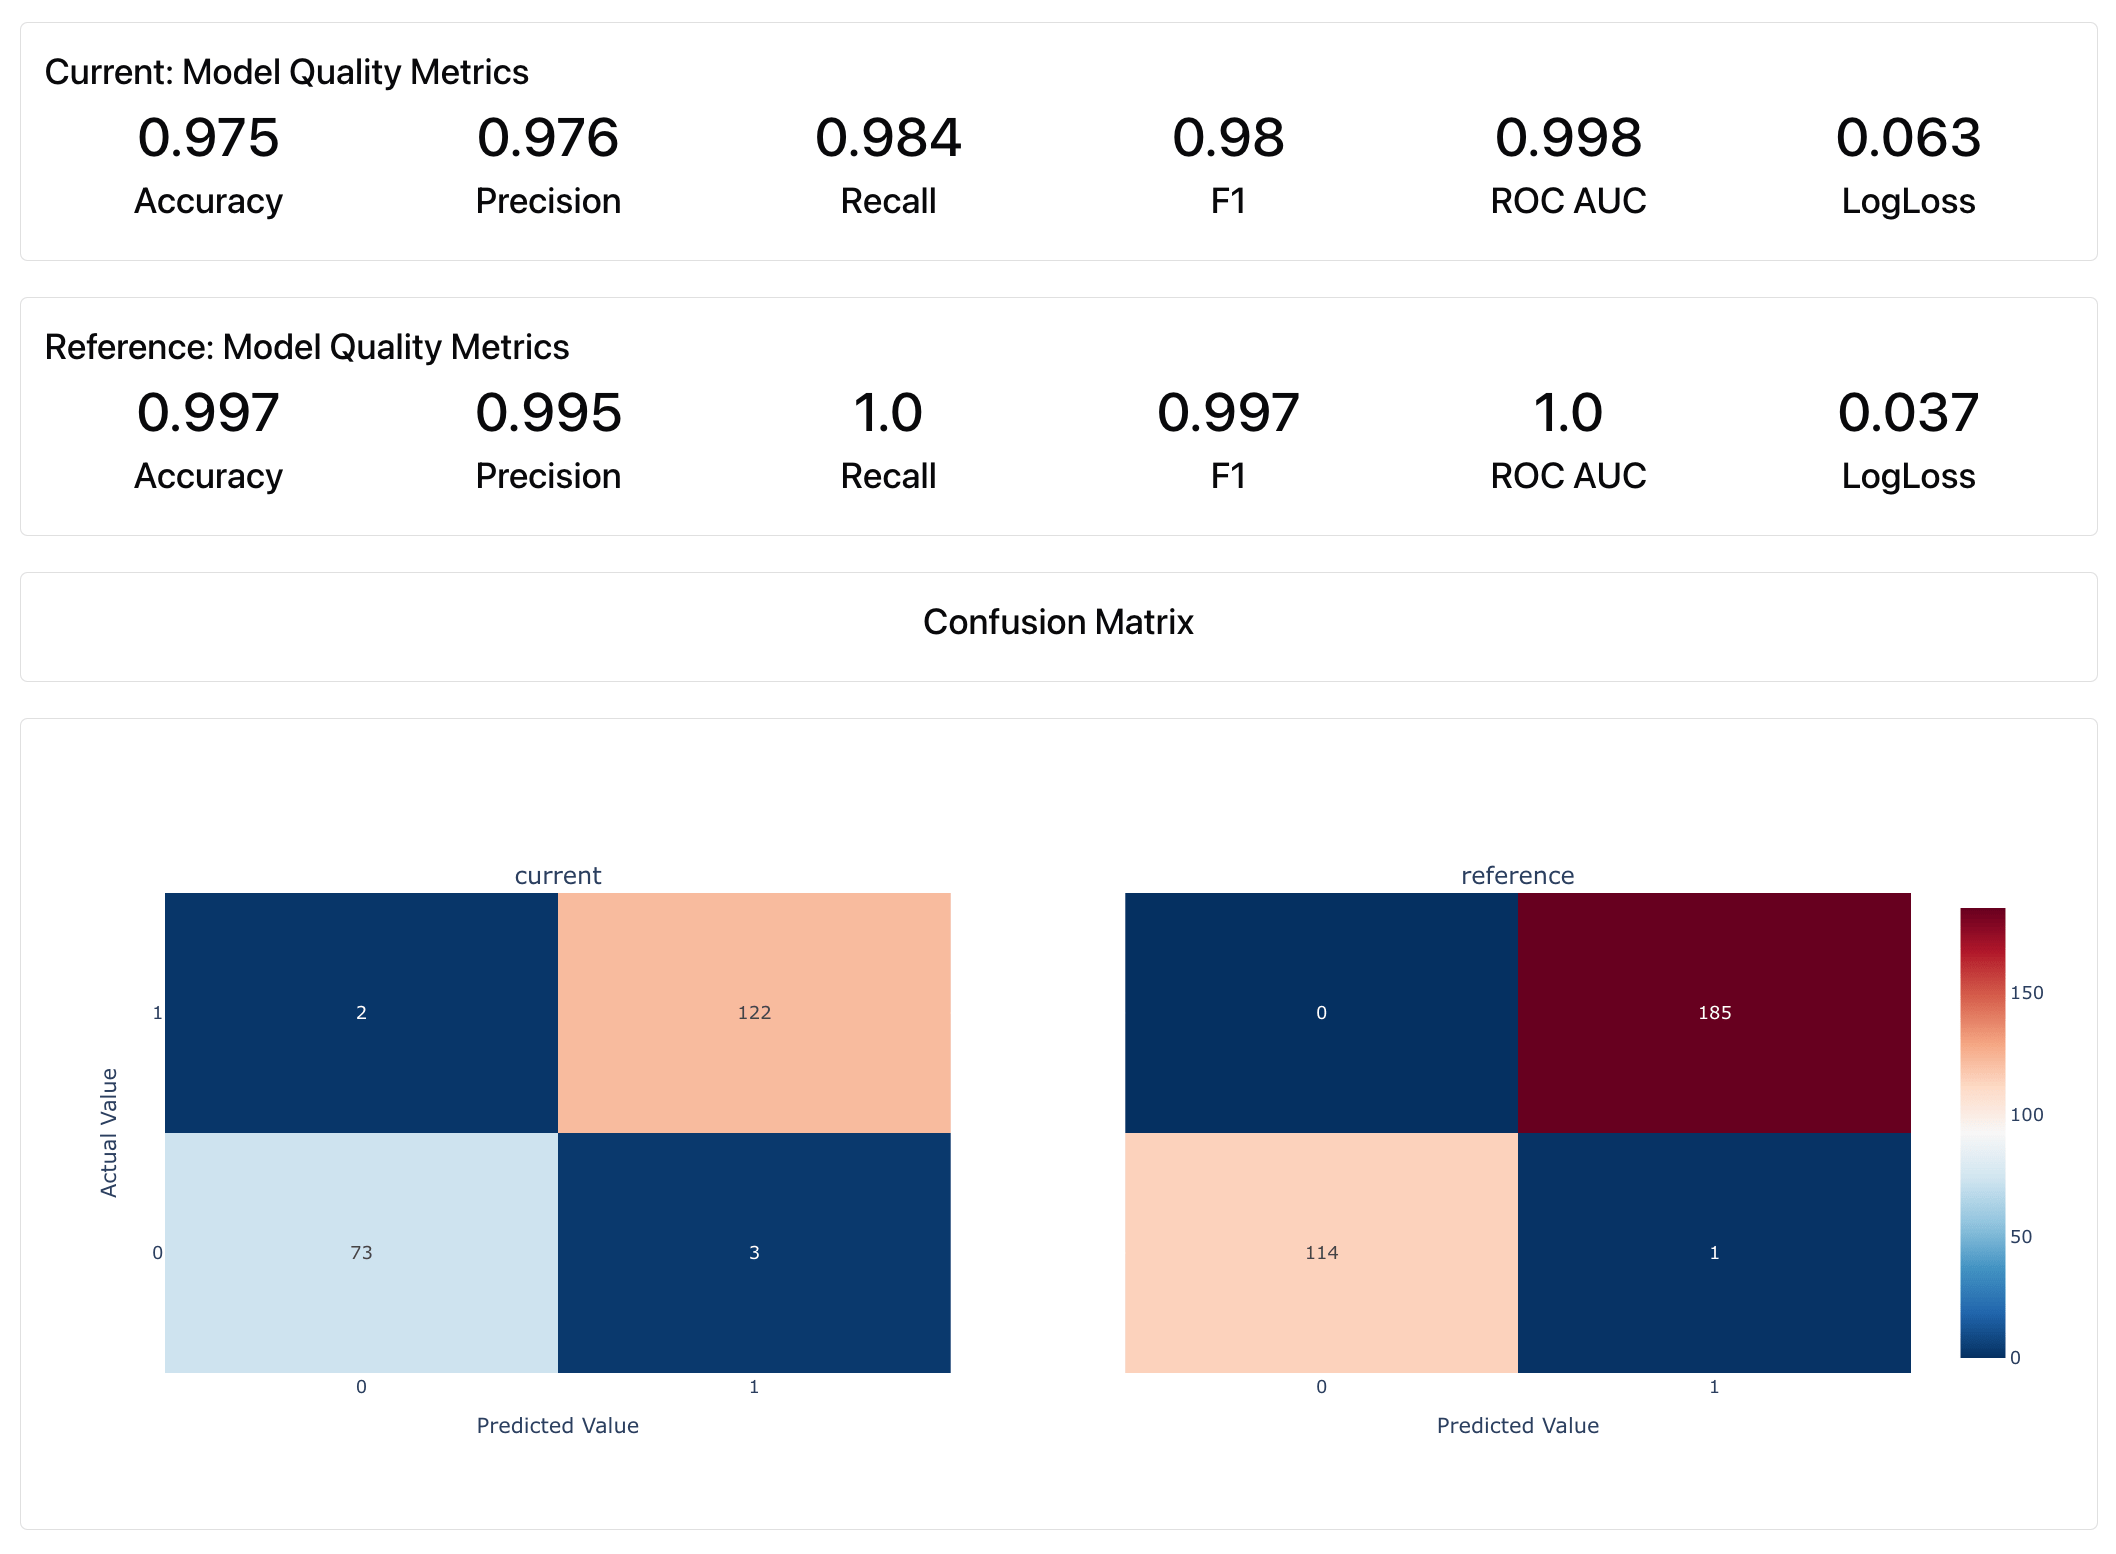
DatasetStats give quick overview of all dataset-level stats, ClassificationQuality computes multiple metrics like Precision, Recall, Accuracy, ROC AUC, etc.
Explore all Built-in Metrics.
Test Suites
Reports are great for analysis and debugging, or logging metrics during monitoring. However, in many cases, you don’t want to review all the scores but run a conditional check to confirm that nothing is off. In this case, Tests are a great option.Tests
Tests let you validate your results against specific expectations. You create a Test by adding a condition parameter to a Metric. Each Test will calculate a given value, check it against the rule, and report a pass/fail result.- You can run multiple Tests in one go.
- You can create Tests on the dataset or column level.
- You can formulate custom conditions or use defaults.
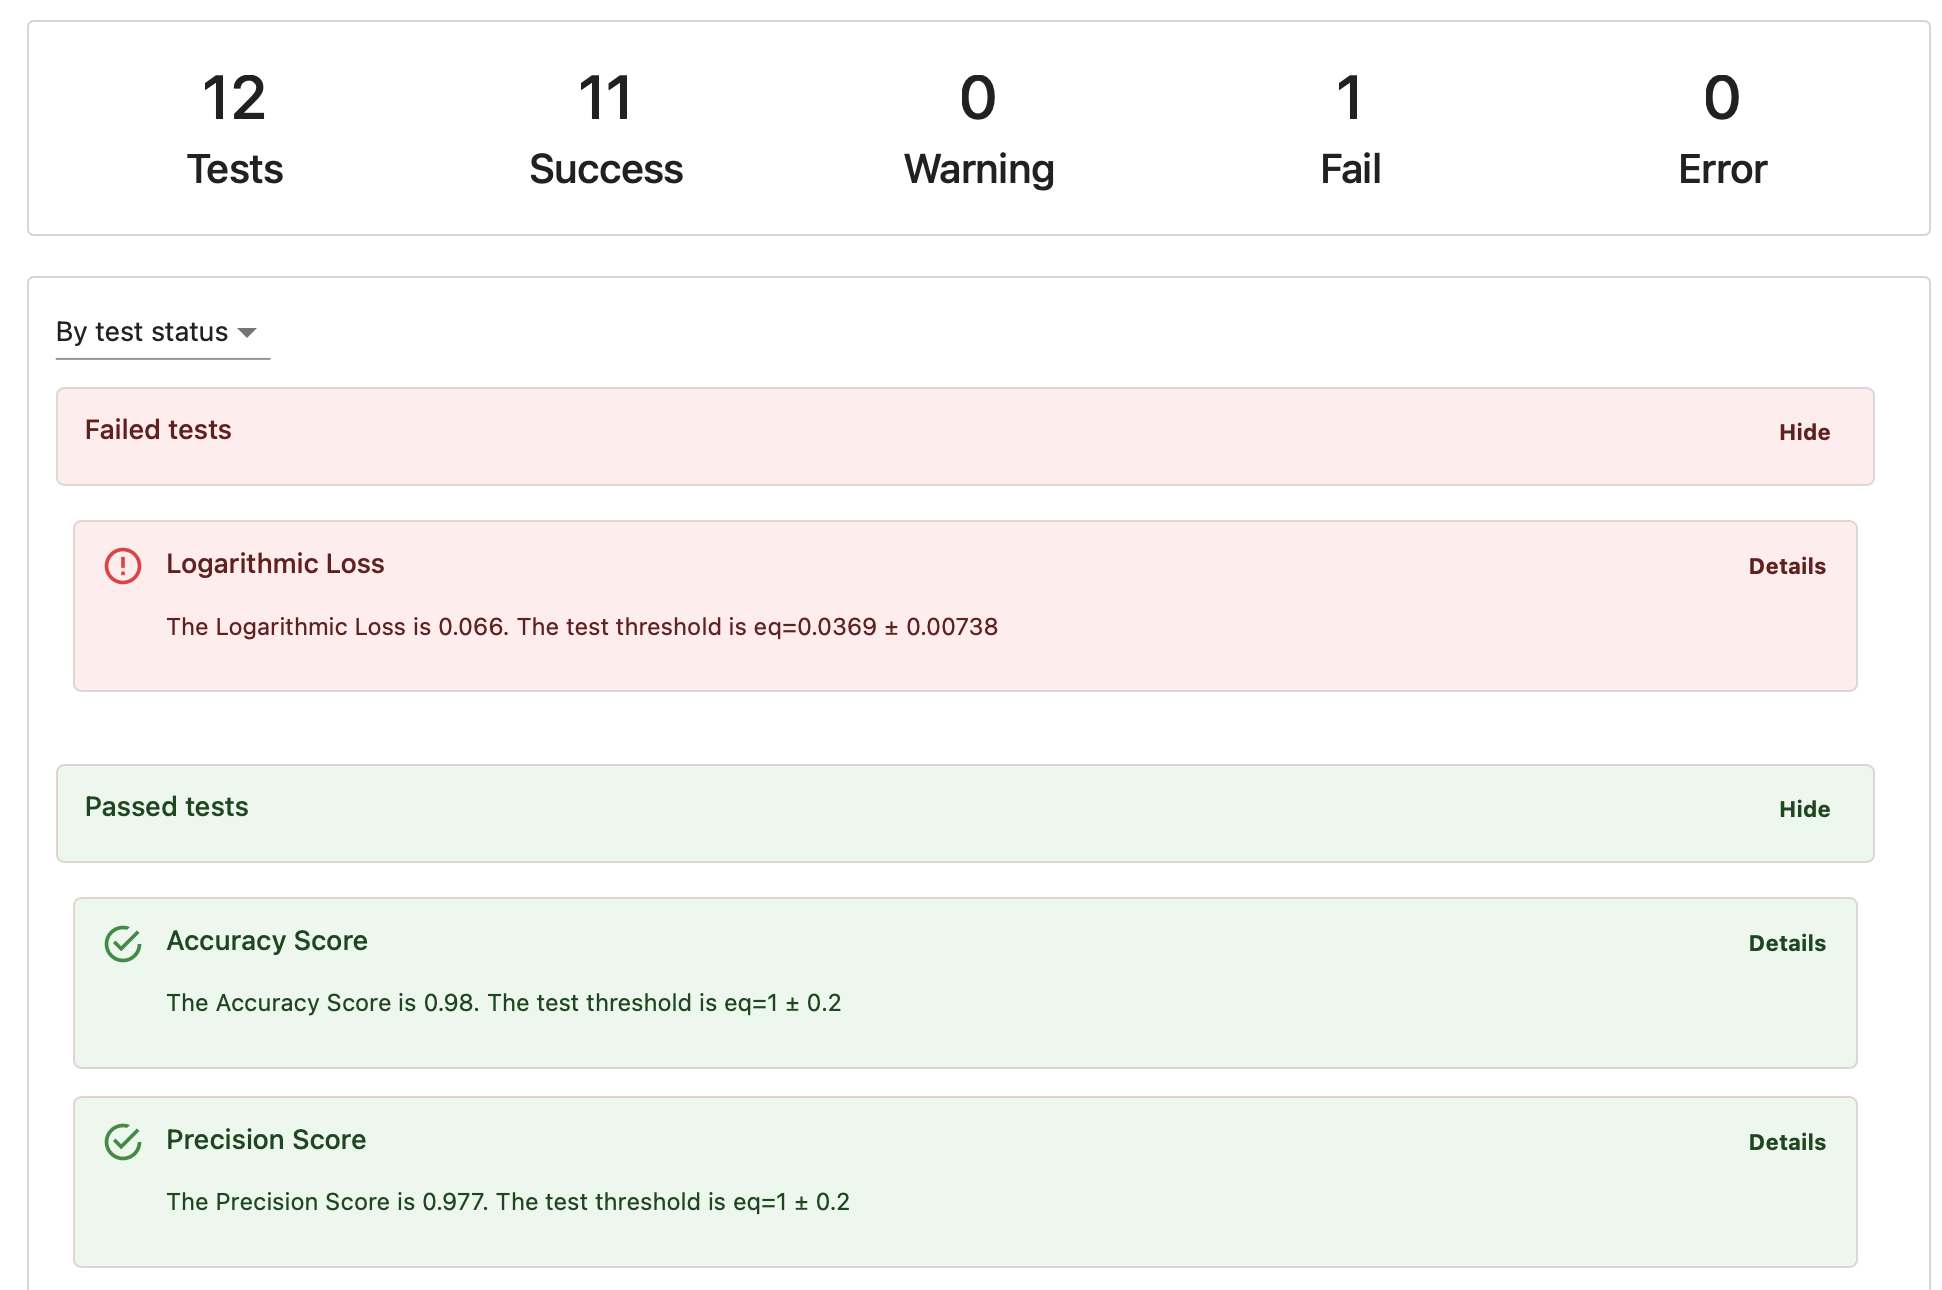
- Pass: The condition was met.
- Fail: The condition wasn’t met.
- Warning: The condition wasn’t met, but the check is marked as non-critical.
- Error: Something went wrong with the Test itself, such as an execution error.
Test Conditions
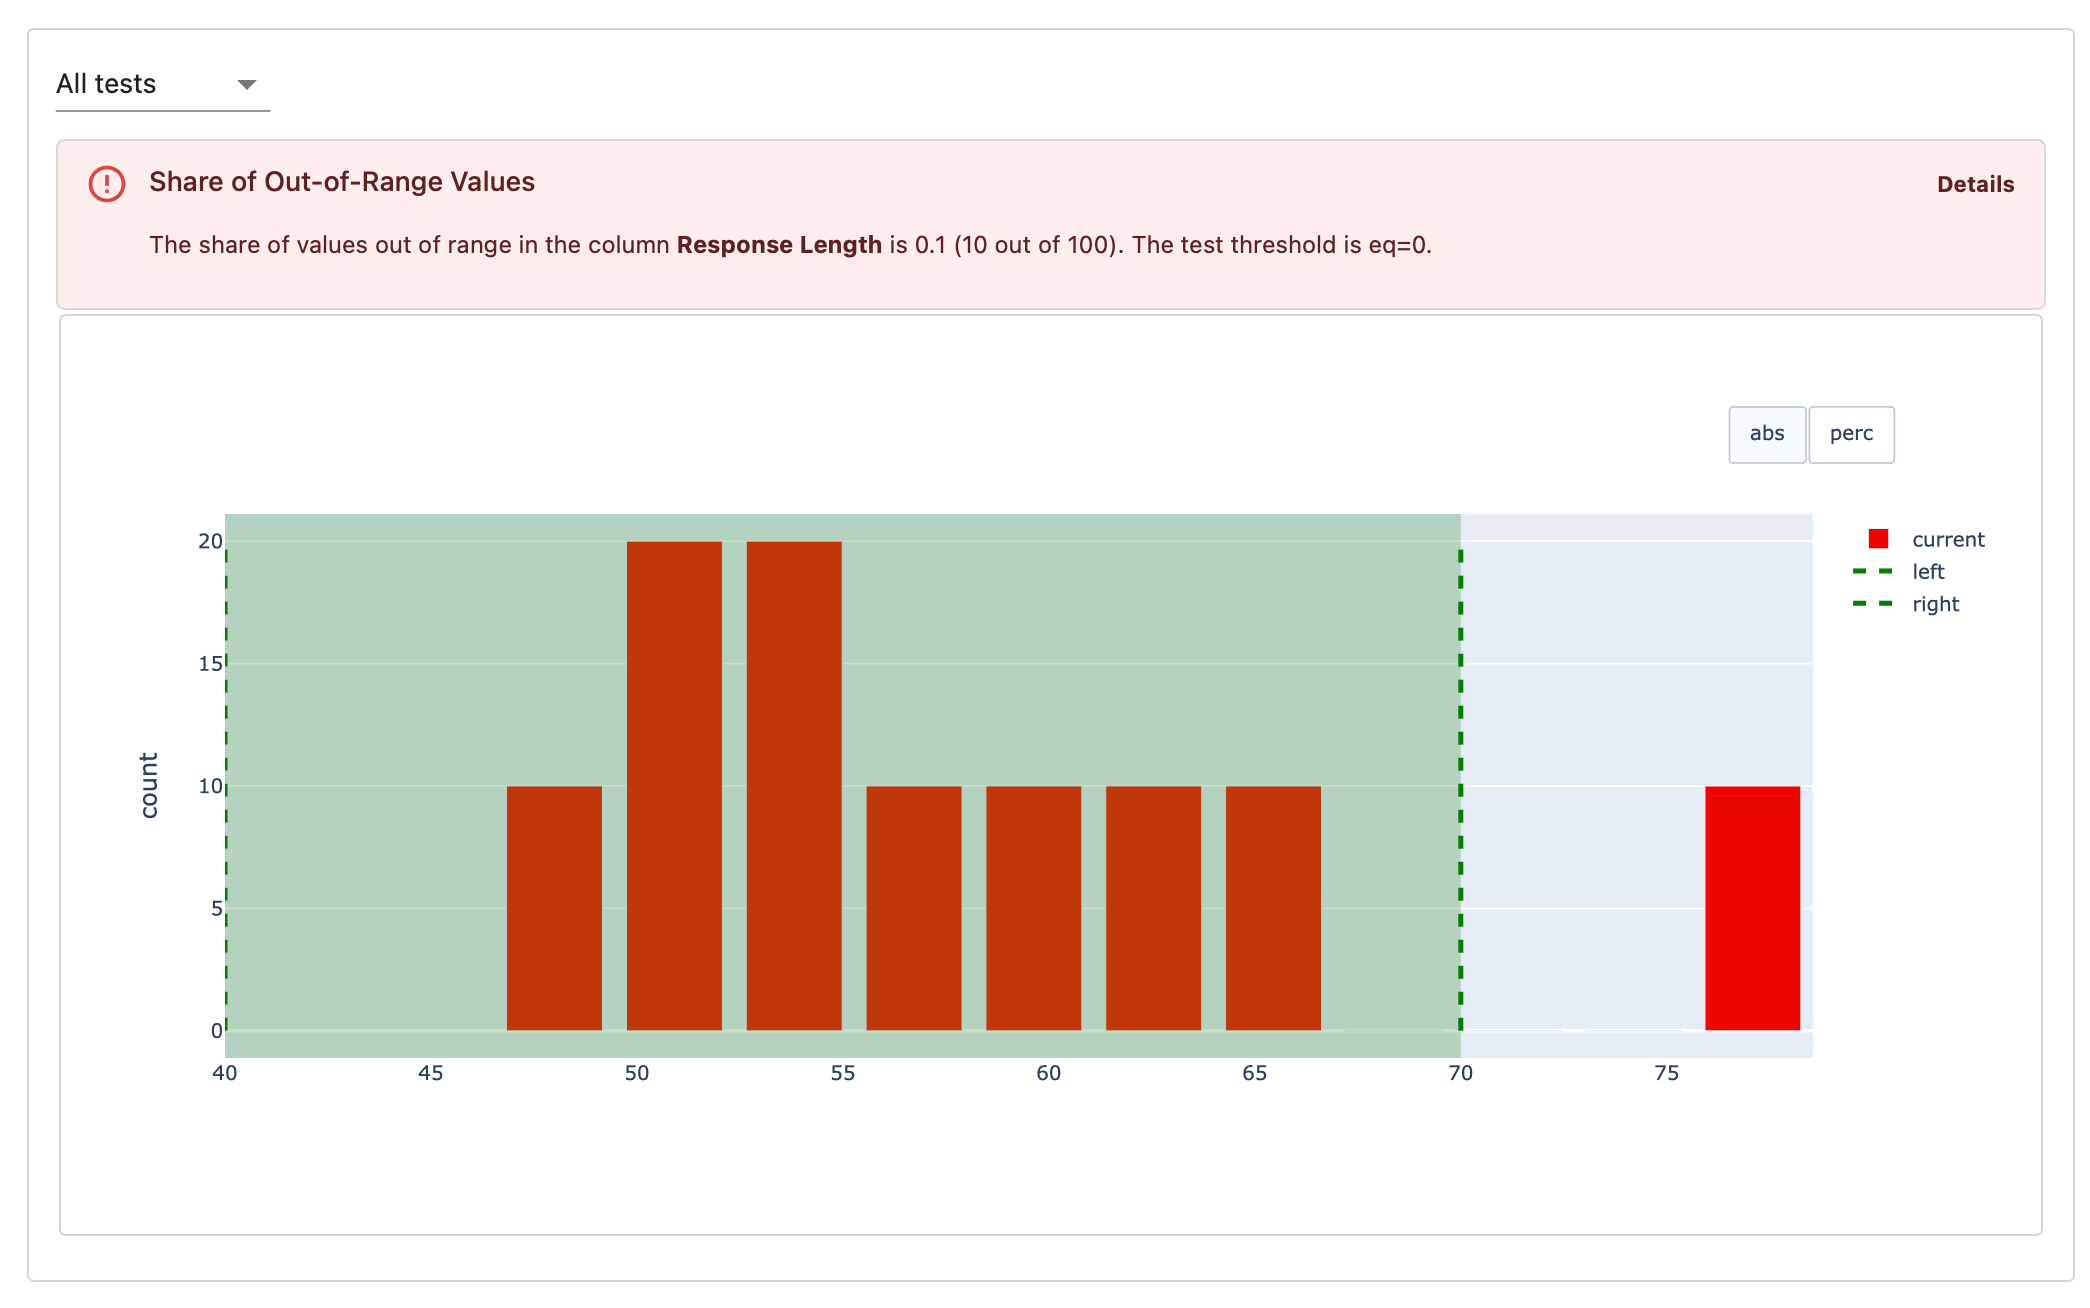
Evidently has a powerful API to set up Test conditions.- Manual setup. You can add thresholds to Metrics one by one, using simple syntax like
greater than (gt)orless than (lt). By picking different Metrics to test against, you can formulate fine-grained conditions like “less than 10% of texts can fall outside 10–100 character length.” - Manual setup with reference. If you have a reference dataset (like a previous data batch), you can set conditions relative to it. For example, you can check if the min-max value range stays within ±5% of the reference range without setting exact thresholds.
- Automatic setup. You can run any Test using built-in defaults. These are either:
- Heuristics. For example, the Test on missing values assumes none should be preset.
- Heuristics relative to reference. Here, conditions adjust to a reference. For instance, the Test on missing values assumes their share should stay within ±10% of the reference.
Test Presets
For even faster setup, there are Test Presets. Each Metric Preset has a corresponding Test Preset that you can enable as an add-on. When you do this:- Evidently adds a predefined set of Tests to your Report.
- These Tests use default conditions, either static or inferred from the reference dataset.
- Data Summary. The Metric Preset gives an overview and stats for all columns. The Test Suite checks for quality issues like missing values, duplicates, etc. across all values.
- Classification. The Metric Preset shows quality metrics like precision or recall. The Test Suite verifies these metrics against a baseline, like a dummy baseline calculated by Evidently or previous model performance.
Building your workflow
You can use Evidently Reports and Test Suites on their own or as part of a monitoring system.Independent use
Reports are great for exploratory evals:- Ad hoc evals. Run one-time analyses on your data, models or LLM outputs.
- Experiments. Compare models, prompts, or datasets side by side.
- Debugging. Investigate data or model issues.
- Data validation. Test inputs and outputs in prediction pipelines.
- CI/CD and regression testing. Check AI system performance after updates.
- Safety testing. Run structured behavioral tests like adversarial testing.
As part of platform
You can use Reports together with the Evidently Platform in production workflows:- Reports serve as a metric computation layer, running evaluations on your data.
- The Platform lets you store, compare, track and alert on evaluation results.
- Experiments. Log evaluations while experimenting with prompts or model versions. Use the Platform to compare runs and track progress.
- Regression Tests. Use Test Suites to validate updates on your golden dataset. Debug failures and maintain a history of results on the Platform.
- Batch Monitoring. Integrate Reports into your data pipelines to compute Metrics for data batches. Use the Platform for performance tracking and alerting.
- Self-host the open-source platform version.
- Sign up for Evidently Cloud (Recommended).