The result of each evaluation is a Report (summary of metrics with visuals) with an optional Test Suite (when it also includes pass/fail results on set conditions).Browse the results. To access the results of your evaluations, enter your Project and navigate to the “Reports” section in the left menu. Here, you can view all your evaluation artifacts and browse them by Tags, time, or metadata. You can also download them as HTML or JSON.To see and compare the evaluation results, click on “Explore” next to the individual Report.Explore view. You’ll get the Report or Test Suite and, if available, the dataset linked to the evaluation.
To view the Report only, click on the “Dataset” sign at the top to hide the dataset.
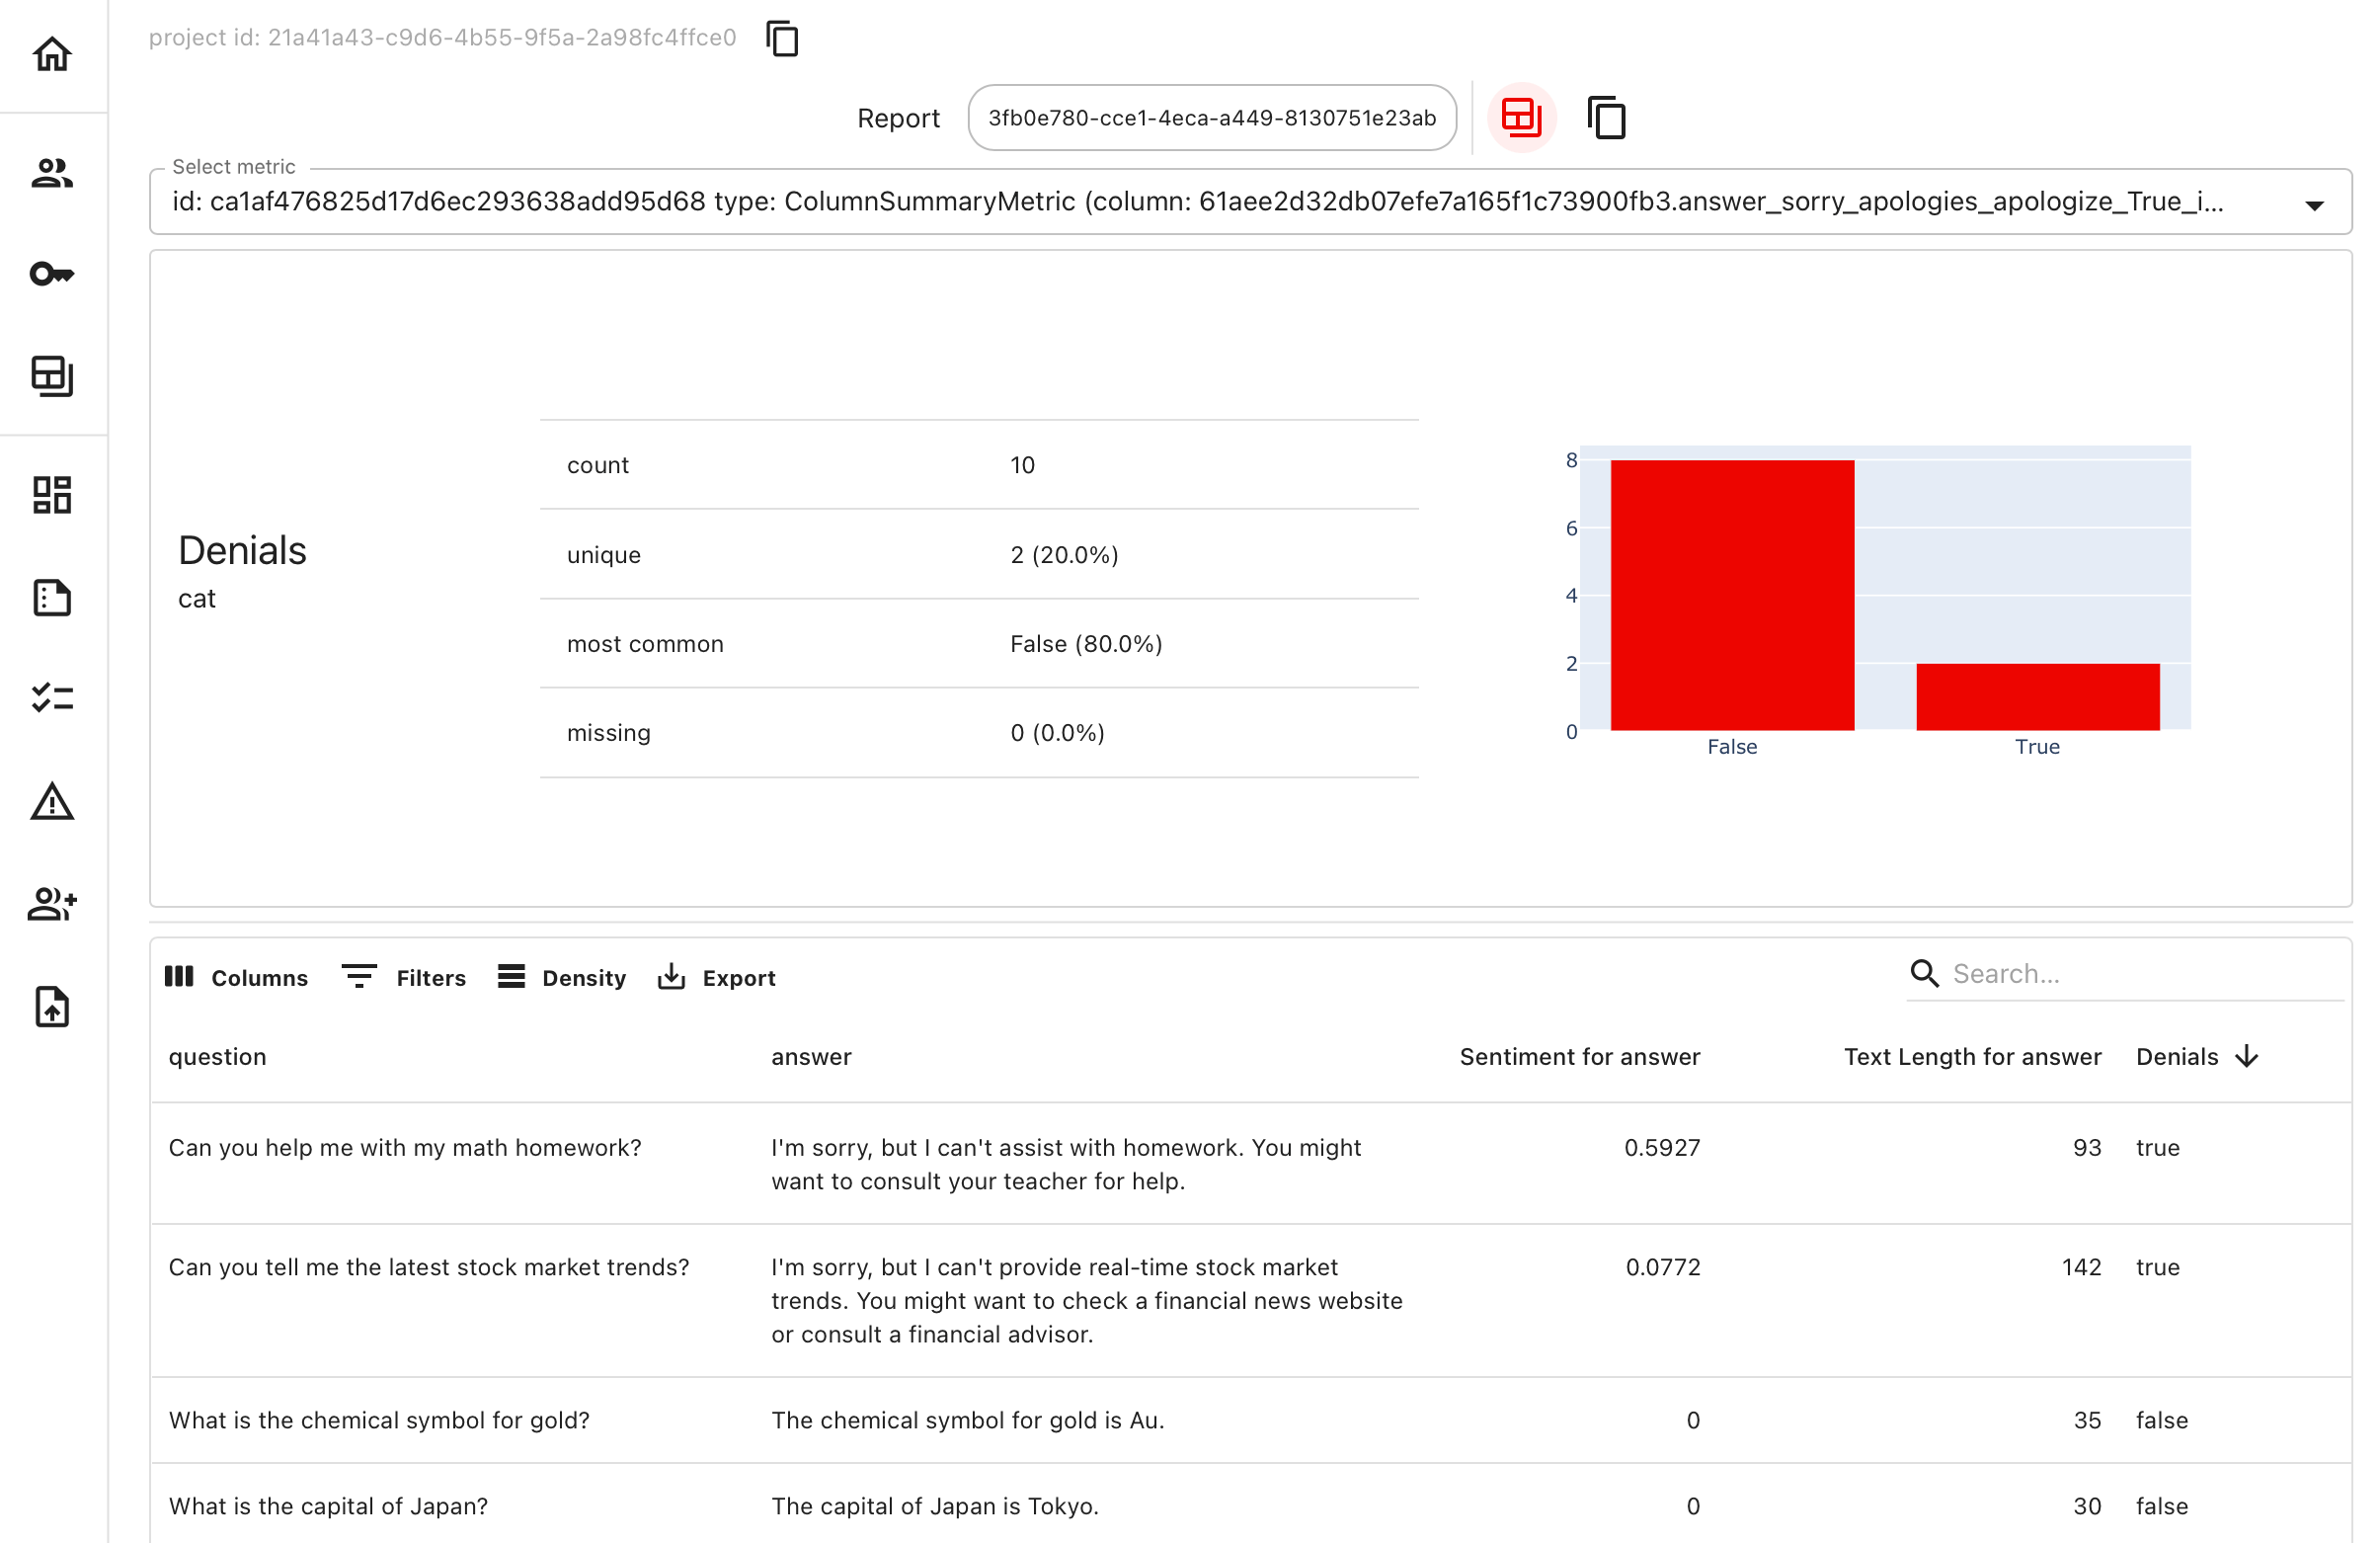
To explore the Dataset only, choose “Go to dataset”.
Compare. To analyze multiple evaluation results side by side, simply select them from the Report list (e.g., reports generated using different LLMs) and click the “Compare” button. This allows you to quickly identify differences in performance, quality, or behavior across model versions or configurations.You will see the Compare view, where you can explore different metric scores (or pass/fail test results) side by side.Alternatively, when you are viewing a specific Report, you can click on “duplicate snapshot” (this will keep the current Metric in view), and then select a different Report for comparison.Track progress over time. As you run multiple evaluations, you can build a Dashboard to track progress, see performance improvements, and monitor how tests perform over time. This will let you visualize results over time from multiple Reports within a Project. Read more.