Batch monitoring
How to run batch monitoring workflows.
For an overview of monitoring architectures, read the introduction.
In a batch monitoring workflow, you regularly run evaluation jobs and log the results to the Evidently Platform for ongoing monitoring.
Code example
Check the tutorials:
Self-host ML MonitoringTutorial - LLM EvaluationHow it works
Here’s a general overview of how batch monitoring works:
1. Create a monitoring Project. This will organize all your data and evaluation results in one place.
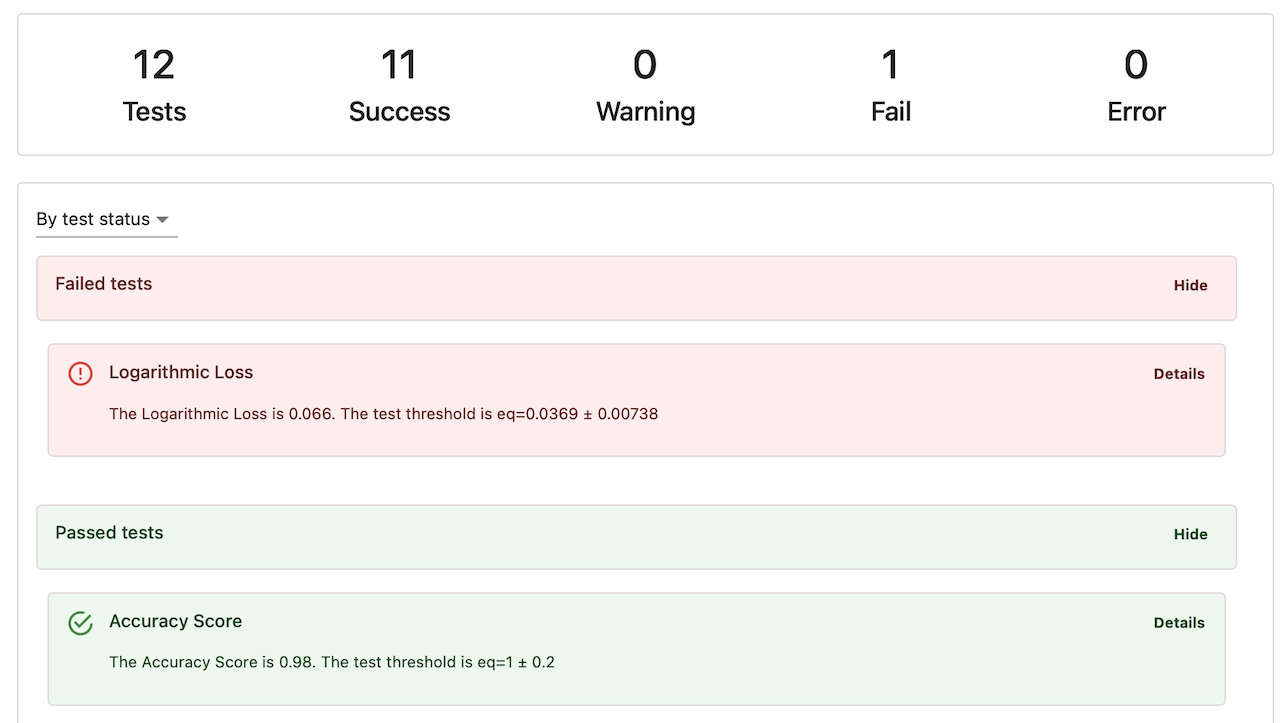
2. Configure evaluations. Decide which Reports and Test Suites you want to run at regular intervals. These could focus on data quality, data drift, model performance, or LLM output quality.
3. Design monitoring jobs. Set up jobs to run evaluations at specific points in your prediction pipeline or by querying your prediction database. These jobs will generate JSON snapshots to upload to the platform.
Essentially, you're setting up a routine process to run the same evaluations you might run manually during experimentation. You can run these jobs via a Python script or manage them using workflow tools like Airflow.
Learn how to generate and send snapshots:
Generate snapshotsExample: in a daily scoring pipeline, you could add validation steps to check input data quality and prediction drift with the DataStabilityTestPreset
and DataDriftTestPreset
. Another job could compute model quality metrics once the true labels are available, using something like BinaryClassificationTestPreset
.
4. Run evaluations and upload results. Once you generate the Reports or Test Suites, upload them to your Project on the Evidently Platform. It's common to send snapshots at regular intervals, such as hourly or daily, though you can also upload them with a delay if needed.
Use Tags and timestamps to organize your evaluation results.
Optionally, you can also upload the Dataset along with the snapshot to store it on the platform.
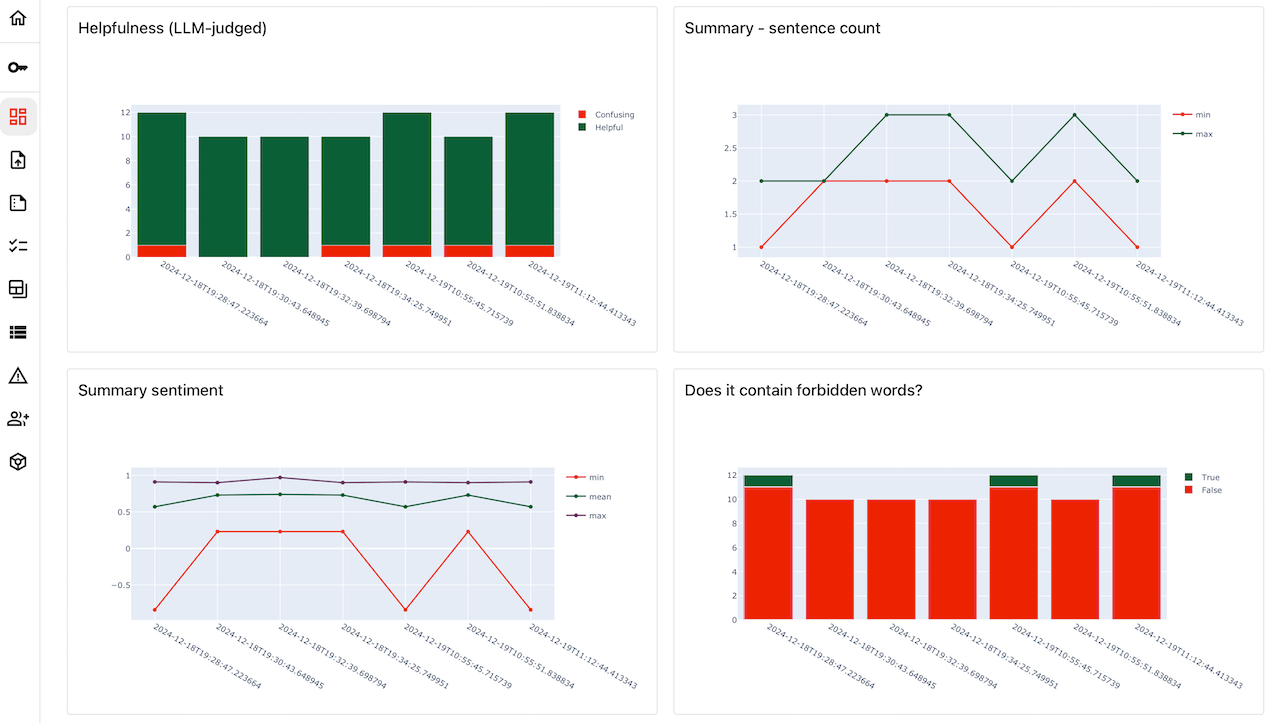
5. Configure the Dashboard. Set up a Dashboard to monitor key metrics over time.
You can use pre-built dashboards like "Column Tabs," "Data Drift," or "Data Quality," or create custom ones to track specific results. The original Reports or Test Suites will still be available in your Project, making it easy to dig into the details if something goes wrong. For example, if you notice an increase in drifting features, you can jump into the source Report to see column distribution summaries and troubleshoot the issue.
Learn more about the monitoring Dashboard:
Dashboard overview5. Set Alerts. Configure alerts to notify you when Tests fail, or if specific metrics go out of bounds.
Learn more about alerts:
Send alertsSpecial cases
Delayed ground truth
In many ML applications, ground truth data is delayed. For example, you might generate demand forecasts, but the actual sales values to assess the model’s quality arrive after a week.
To handle this, you can split your monitoring steps:
Check inputs. When you get a new batch of data, capture a summary snapshot and check the data quality (missing values, duplicates, features out of range, etc.)
Evaluate prediction drift. After scoring, check for prediction drift to detect shifts in model behavior.
Assess model quality. Once you receive the true labels, compute model quality metrics (e.g., mean error, RMSE for regression, or accuracy, precision, recall for classification) and add them to the same monitoring project.
Evidently lets you backdate snapshots, so you can log them retroactively. For example, once you receive labeled data and evaluate model quality, you can create a snapshot with the correct timestamp to match the prediction time. This helps ensure your Dashboard accurately reflects the quality for that specific period.
You can also delete and re-upload snapshots if necessary.
A/B testing
If you have two model versions in production with split traffic (like champion/challenger models) or a shadow model running alongside, you can monitor the quality of both models simultaneously.
Attach Tags when generating snapshots to differentiate between the models (versions, prompts, etc.). This way, you can later visualize the performance on a Dashboard using data from snapshots with specific Tags, effectively tracking the quality of Model A versus Model B side by side.
Multiple models in a Project
If you're working with several related models or segments, you can log data for all of them within the same Project.
Evidently lets you log multiple snapshots of the same type for the same period, so you can freely design your workflow. Use Tags to distinguish between different models or segments.
For example, you could track the performance of multiple demand forecasting models for different locations by logging all snapshots to the Project with location-specific Tags. Then, you can add separate monitoring Panels on your Dashboard for each area and see how the model performs in each one.
In-pipeline testing
You can directly use the results of Evidently evaluations within your infrastructure in addition to sending the data to the platform.
For instance, if you've integrated data checks into your prediction pipeline, you might want to halt the pipeline if data quality or data drift tests fail, or if the retrained model's quality doesn't meet a certain threshold.
In this scenario, after running an Evidently Report or Test Suite, you can do both:
Send snapshots to Evidently Platform for tracking the outcomes.
Run an in-pipeline action. You can export the results of Evidently evaluation as a Python dictionary or a JSON and use the output (e.g., the success or failure of a Test Suite) to trigger actions within the pipeline. This enables you to react immediately while still recording results on the platform.
Last updated