What is Evidently?

Evidently helps evaluate, test, and monitor data and ML-powered systems.

  • Predictive tasks: classification, regression, ranking, recommendations.

  • Generative tasks: chatbots, RAGs, Q&A, summarization.

  • Data monitoring: data quality and data drift for text, tabular data, embeddings.

Evidently is available both as an open-source Python library and Evidently Cloud platform.

Get started

Choose a Quickstart (1-2min) or a Tutorial (15 min) to start.

LLM evaluations

Run checks for text data and generative LLM outputs.

Tabular data checks

Run evaluations for tabular data and ML models.

Monitoring Dashboard

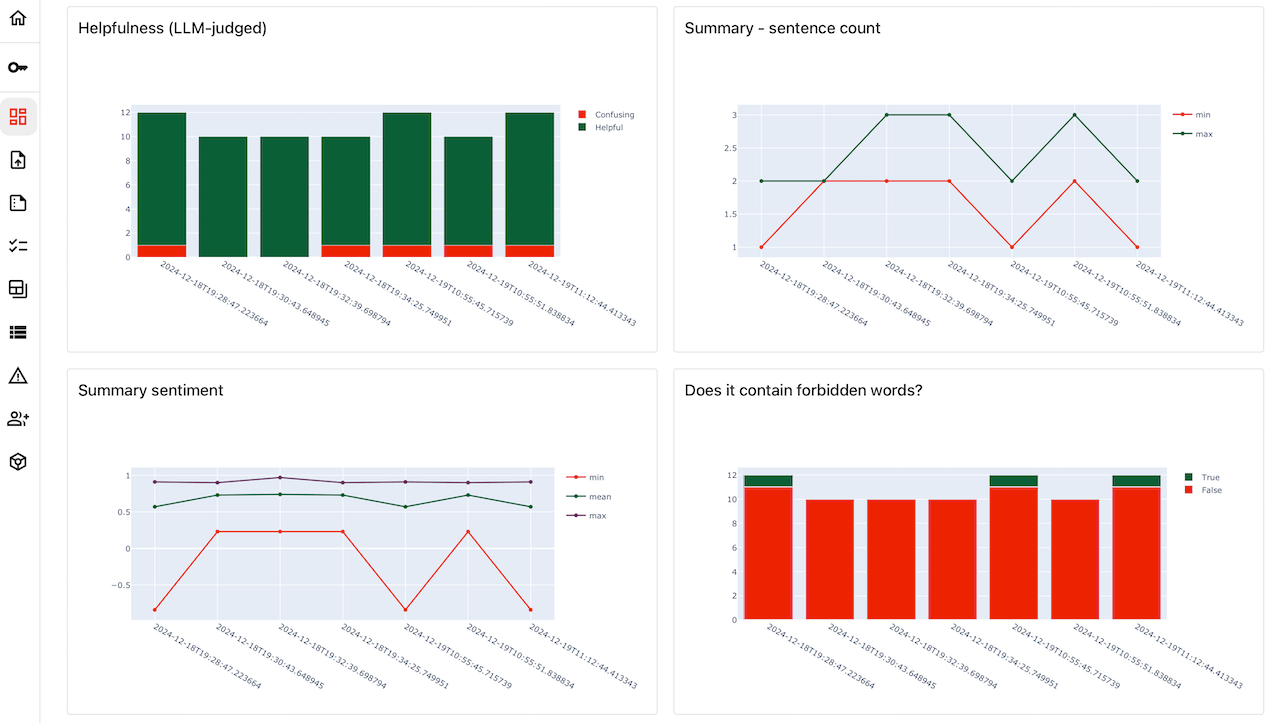
Get a live dashboard to track evaluation results over time.

You can explore more code examples.

How it works

Evidently helps evaluate and track quality of ML-based systems, from experimentation to production.

Evidently is both a library of 100+ ready-made evaluations, and a framework to easily implement yours: from Python functions to LLM judges.

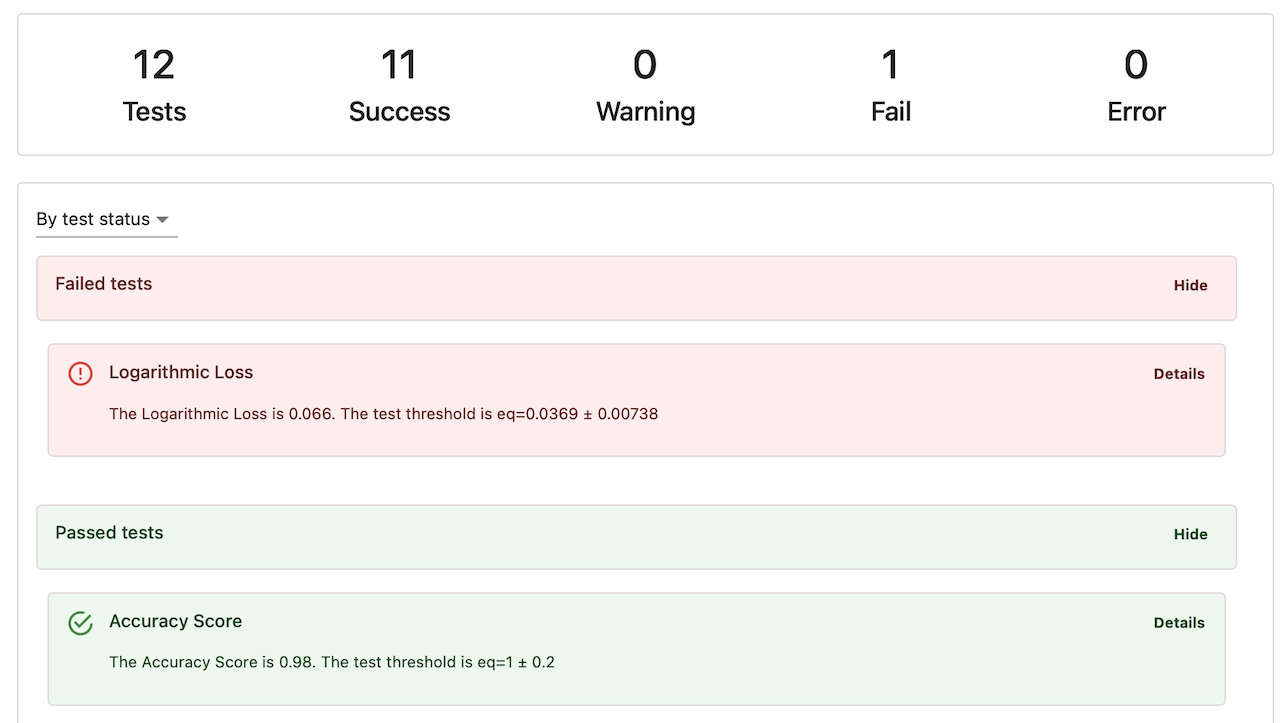
Evidently has a modular architecture, and you can start with ad hoc checks without complex installations. There are 3 interfaces: you can get a visual Report to see a summary of evaluation metrics, run conditional checks with a TestSuite to get a pass/fail outcome, or plot the evaluation results over time on a Monitoring Dashboard.

Reports

Reports compute different metrics on data and ML quality. You can use Reports for visual analysis and debugging, or as a computation layer for the monitoring dashboard.

You can be as hands-off or hands-on as you like: start with Presets, and customize metrics as you go.

More on Reports
  • You can pass a single dataset or two for side-by-side comparison.

    • Pass data as a CSV, pandas or Spark dataframe.

  • You can get pre-built Reports with Presets, or combine individual Metrics.

  • You can use Reports as a standalone tool:

    • For exploration and debugging: view results in Python or export as HTML.

    • As a computation layer: export results to Python dictionary, JSON or dataframe.

    • For documentation: add text comments and save Model Card.

  • You can also use Reports as a component of ML Monitoring system:

    • Compute Reports on a cadence over live data and save as JSON snapshots.

    • Visualize results from multiple Reports over time on the Monitoring Dashboard.

    • Configure alerts when metrics are out of bounds.

Docs:

Tests suites

Tests verify whether computed metrics satisfy defined conditions. Each Test returns a pass or fail result.

This interface helps automate your evaluations for regression testing, checks during CI/CD, or validation steps in data pipelines.

More on Test Suites
  • You can set Test conditions manually or auto-generate conditions from a reference dataset.

  • You can get pre-built Test Suites with Presets, or combine individual Tests.

  • You can see Test results in a visual report or get a JSON or Python export.

  • You can use Test Suites as a standalone tool:

    • Regression testing during experimentation.

    • Automated CI/CD checks after you get new labeled data or update models.

    • Pipeline testing: add a validation step to your data pipelines.

  • You can also use Test Suites as a component of ML Monitoring system:

    • Run automated Test Suites and save results as JSON snapshots.

    • Show test outcomes and metrics metrics on the Monitoring Dashboard.

    • Configure alerts on failed Tests.

Docs:

ML monitoring dashboard

The monitoring dashboard helps visualize ML system performance over time and detect issues. You can track key metrics and test outcomes.

You can use Evidently Cloud or self-host. Evidently Cloud offers extra features like user authentication and roles, built-in alerting, and a no-code interface.

More on Monitoring Dashboard
  • You save Reports or Test Suites as JSON snapshots. The monitoring dashboard runs over these evaluation results as a data source.

  • You can create custom combinations of Panels and choose what exactly to plot.

  • You can get dashboards as code for version control and reproducibility.

  • You can send data in near real-time using a Collector service or in batches.

  • For Evidently Cloud: send alerts to Slack, Discord, and email.

  • For Evidently Cloud: get pre-built Tabs and manage everything in the UI.

Docs:

What can you evaluate?

Evidently Reports, Test Suites and ML Monitoring dashboard rely on the shared set of metrics. Here are some examples of what you can evaluate.

Evaluation groupExamples

Tabular Data Quality

Missing values, duplicates, empty rows or columns, min-max ranges, new categorical values, correlation changes, etc.

Text Descriptors

Text length, out-of-vocabulary words, share of special symbols, regular expressions matches.

Data Distribution Drift

Statistical tests and distance metrics to compare distributions of model predictions, numerical and categorical features, text data, or embeddings.

Classification Quality

Accuracy, precision, recall, ROC AUC, confusion matrix, class separation quality, classification bias.

Regression Quality

MAE, ME, RMSE, error distribution, error normality, error bias per group and feature.

Ranking and Recommendations

NDCG, MAP, MRR, Hit Rate, recommendation serendipity, novelty, diversity, popularity bias.

LLM Output Quality

Model-based scoring with external models and LLMs to detect toxicity, sentiment, evaluate retrieval relevance, etc.

You can also implement custom checks as Python functions or define your prompts for LLM-as-a-judge.

See more:

Community and support

Evidently is in active development, and we are happy to receive and incorporate feedback. If you have any questions, ideas or want to hang out and chat about doing ML in production, join our Discord community!

User newsletter

To get updates on new features, integrations and code tutorials, sign up for the Evidently User Newsletter.

Last updated