> ## Documentation Index
> Fetch the complete documentation index at: https://docs.evidentlyai.com/llms.txt
> Use this file to discover all available pages before exploring further.
# Data and ML checks
> Run a simple evaluation for tabular data
Need help? Ask on [Discord](https://discord.com/invite/xZjKRaNp8b).
Evidently helps you run tests and evaluations for your production ML systems. This includes:
* evaluating prediction quality (e.g. classification or regression accuracy)
* input data quality (e.g. missing values, out-of-range features)
* data and prediction drift.
Evaluating distribution shifts ([data drift](https://www.evidentlyai.com/ml-in-production/data-drift)) in ML inputs and predictions is a typical use case that helps you detect shifts in the model quality and environment even without ground truth labels.
In this Quickstart, you'll run a simple data drift report in Python and view the results in an interactive Python environment like Jupyter notebook or Colab.
## 1. Set up your environment
Install the Evidently Python library:
```python theme={null}
!pip install evidently
```
Components to run the evals:
```python theme={null}
import pandas as pd
from sklearn import datasets
from evidently import Dataset
from evidently import DataDefinition
from evidently import Report
from evidently.presets import DataDriftPreset, DataSummaryPreset
```
## 2. Prepare a toy dataset
Let's import a toy dataset with tabular data:
```python theme={null}
adult_data = datasets.fetch_openml(name="adult", version=2, as_frame="auto")
adult = adult_data.frame
```
If OpenML is not available, you can download the same dataset from here:
```python theme={null}
url = "https://github.com/evidentlyai/evidently/blob/main/test_data/adults.parquet?raw=true"
adult = pd.read_parquet(url, engine='pyarrow')
```
Let's split the data into two and introduce some artificial drift for demo purposes. `Prod` data will include people with education levels unseen in the reference dataset:
```python theme={null}
adult_ref = adult[~adult.education.isin(["Some-college", "HS-grad", "Bachelors"])]
adult_prod = adult[adult.education.isin(["Some-college", "HS-grad", "Bachelors"])]
```
Map the column types:
```python theme={null}
schema = DataDefinition(
numerical_columns=["education-num", "age", "capital-gain", "hours-per-week", "capital-loss", "fnlwgt"],
categorical_columns=["education", "occupation", "native-country", "workclass", "marital-status", "relationship", "race", "sex", "class"],
)
```
Create Evidently Datasets to work with:
```python theme={null}
eval_data_1 = Dataset.from_pandas(
pd.DataFrame(adult_prod),
data_definition=schema
)
```
```python theme={null}
eval_data_2 = Dataset.from_pandas(
pd.DataFrame(adult_ref),
data_definition=schema
)
```
`Eval_data_2` will be our reference dataset we'll compare against.
## 3. Get a Report
Let's generate a Data Drift preset that will check for statistical distribution changes between all columns in the dataset.
```python theme={null}
report = Report([
DataDriftPreset()
])
my_eval = report.run(eval_data_1, eval_data_2)
```
You can [customize drift parameters](/metrics/customize_data_drift) by choosing different methods and thresholds. In our case we proceed as is so [default tests](/metrics/explainer_drift) selected by Evidently will apply.
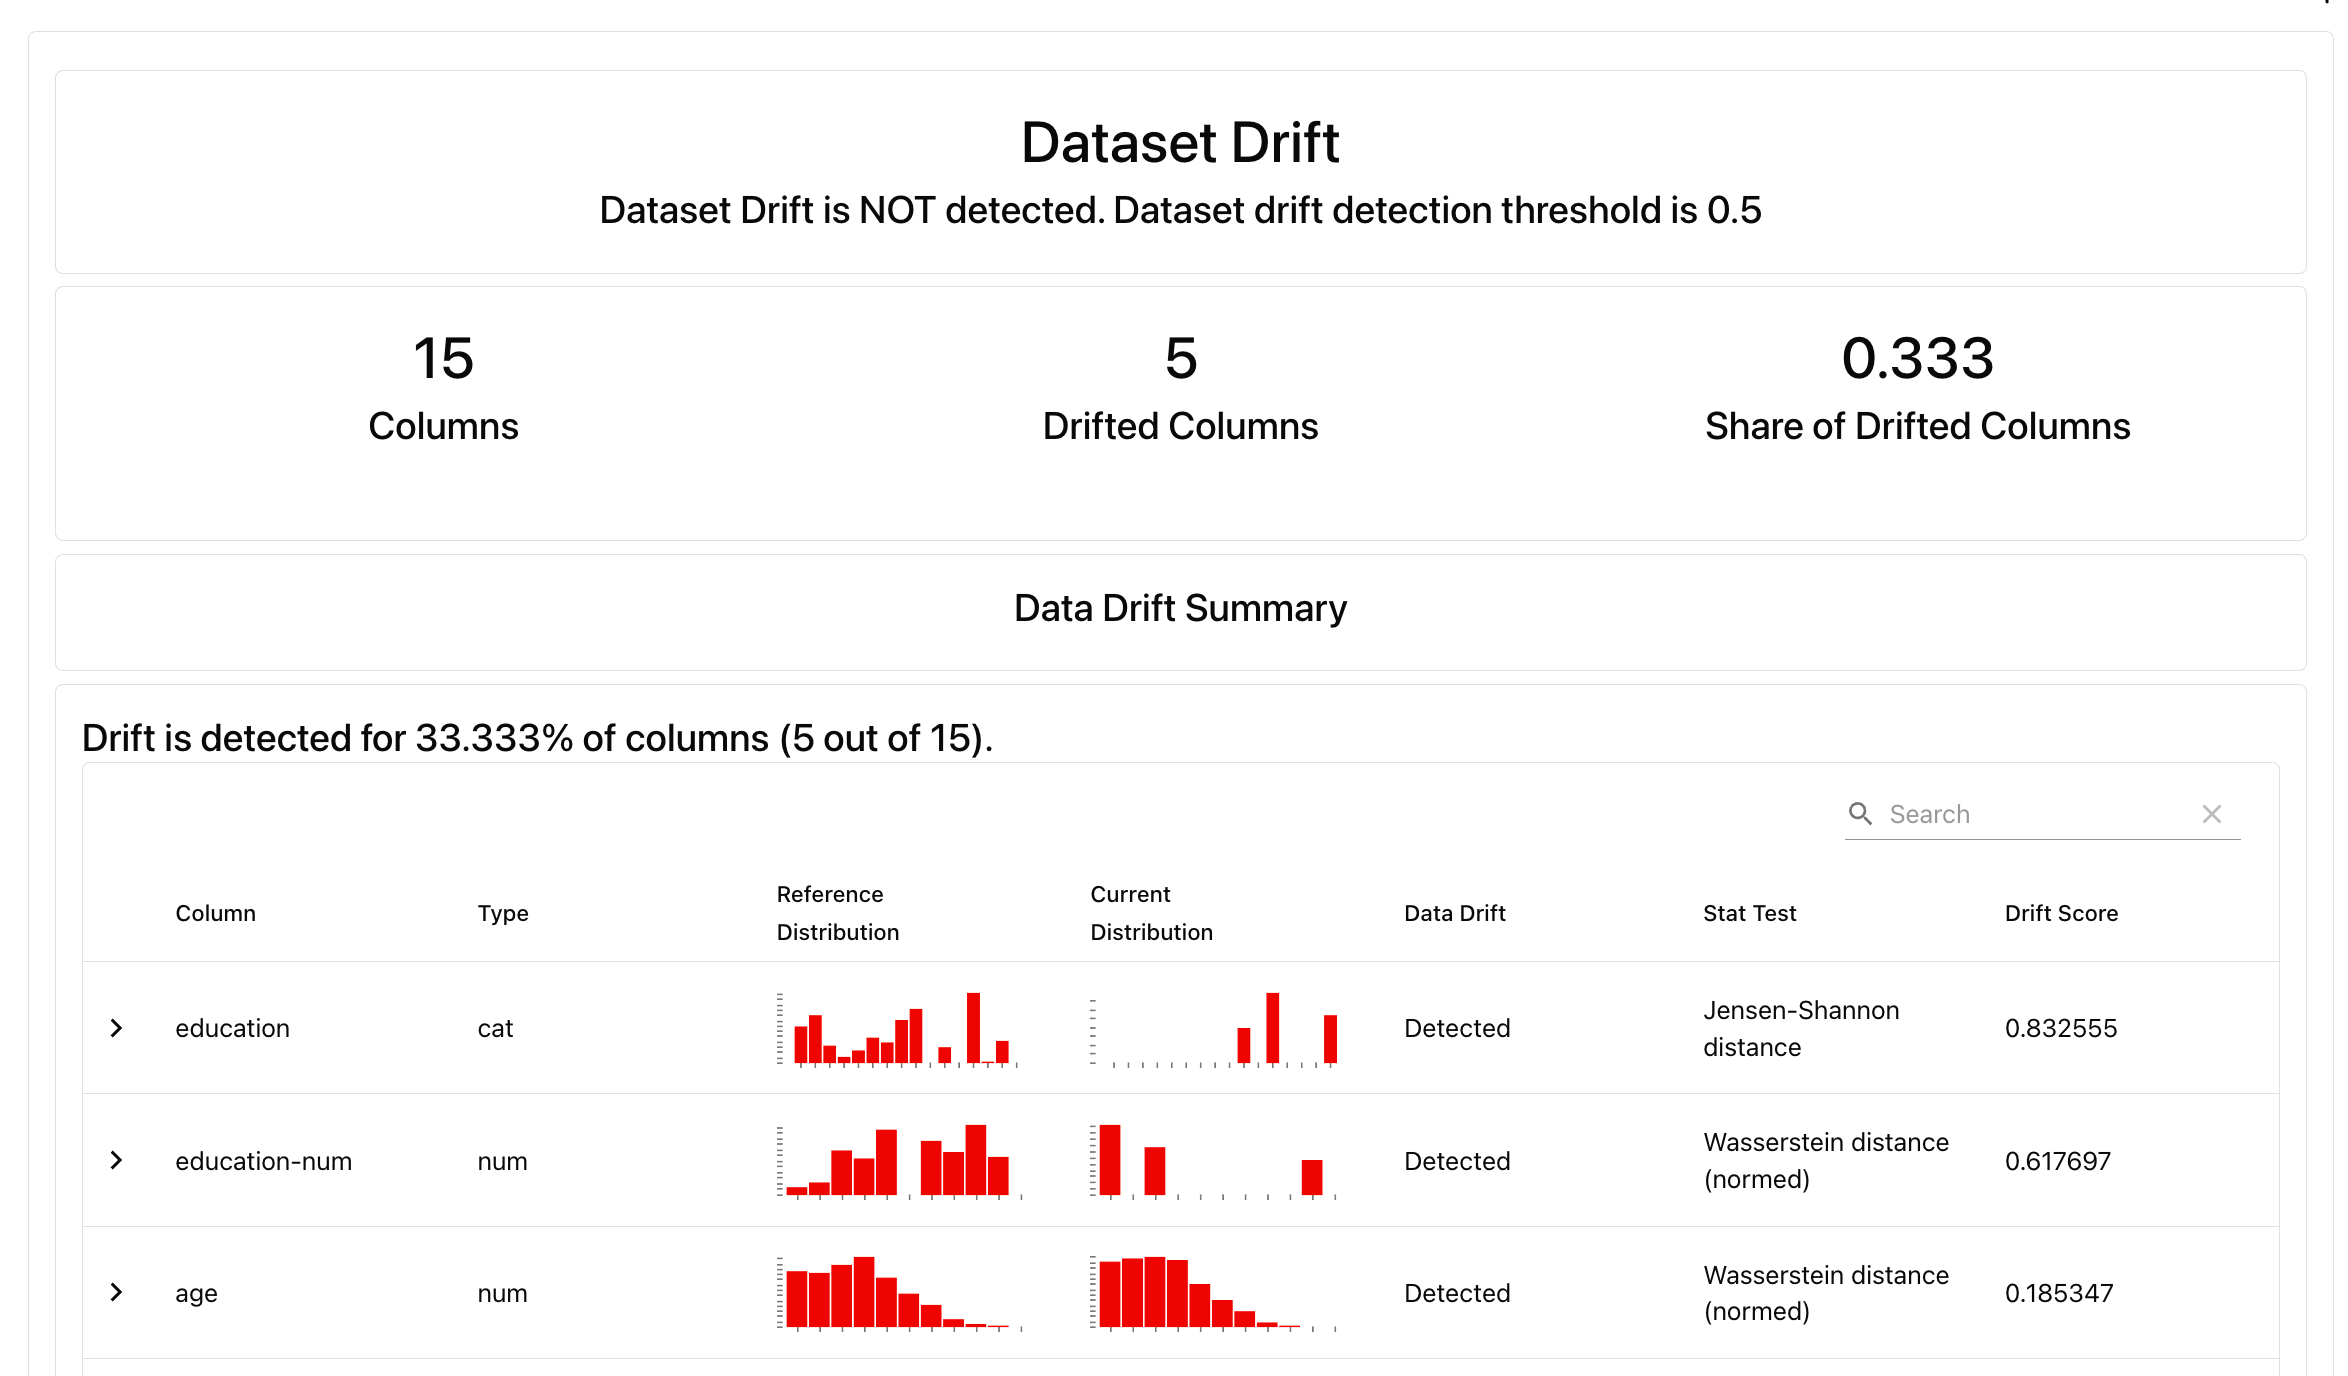
## 4. Explore the results
**Local preview**. In a Python environment like Jupyter notebook or Colab, run:
```python theme={null}
my_eval
```
This will render the Report directly in the notebook cell. You will see the summary with scores and Test results.
 You can also get a JSON or Python dictionary, or save as an external HTML file.
```python theme={null}
# my_eval.json()
# my_eval.dict()
# my_report.save_html(“file.html”)
```
Alternatively, try `DataSummaryPreset` that will generate a summary of all columns in the dataset, and run auto-generated Tests to check for data quality and core descriptive stats.
```text theme={null}
report = Report([
DataSummaryPreset()
],
include_tests="True")
my_eval = report.run(eval_data_1, eval_data_2)
```
# What's next?
Local Reports are great for one-off evaluations. To run continuous monitoring (e.g. track the share of drifting features over time), keep track of the results and collaborate with others, upload the results to Evidently Platform.
* Read more about [platform self-hosting](https://docs.evidentlyai.com/docs/setup/self-hosting).
* See available Evidently Metrics: [All Metric Table](/metrics/all_metrics)
* Understand how you can add conditional tests to your Reports: [Tests](/docs/library/tests).
* Explore options for Dashboard design: [Dashboards](/docs/platform/dashboard_add_panels)
You can also get a JSON or Python dictionary, or save as an external HTML file.
```python theme={null}
# my_eval.json()
# my_eval.dict()
# my_report.save_html(“file.html”)
```
Alternatively, try `DataSummaryPreset` that will generate a summary of all columns in the dataset, and run auto-generated Tests to check for data quality and core descriptive stats.
```text theme={null}
report = Report([
DataSummaryPreset()
],
include_tests="True")
my_eval = report.run(eval_data_1, eval_data_2)
```
# What's next?
Local Reports are great for one-off evaluations. To run continuous monitoring (e.g. track the share of drifting features over time), keep track of the results and collaborate with others, upload the results to Evidently Platform.
* Read more about [platform self-hosting](https://docs.evidentlyai.com/docs/setup/self-hosting).
* See available Evidently Metrics: [All Metric Table](/metrics/all_metrics)
* Understand how you can add conditional tests to your Reports: [Tests](/docs/library/tests).
* Explore options for Dashboard design: [Dashboards](/docs/platform/dashboard_add_panels)