> ## Documentation Index
> Fetch the complete documentation index at: https://docs.evidentlyai.com/llms.txt
> Use this file to discover all available pages before exploring further.
# Data Summary
> Overview of the Data Summary Preset.
**Pre-requisites**:
* You know how to use [Data Definition ](/docs/library/data_definition)to prepare the data.
* You know how to create [Reports](/docs/library/report).
**Report.** To run a Preset on your data for a single `current` dataset:
```python theme={null}
report = Report([
DataSummaryPreset(),
])
my_eval = report.run(current, None)
```
**Test Suite.** To add pass/fail data quality Tests, auto-generated from `ref` dataset:
```python theme={null}
report = Report([
DataSummaryPreset(),
],
include_tests=True)
my_eval = report.run(current, ref)
```
## Overview
The`DataSummaryPreset` lets you visualize key descriptive statistics for the dataset and each column in it. If you pass two datasets, you'll get a side-by-side comparison.
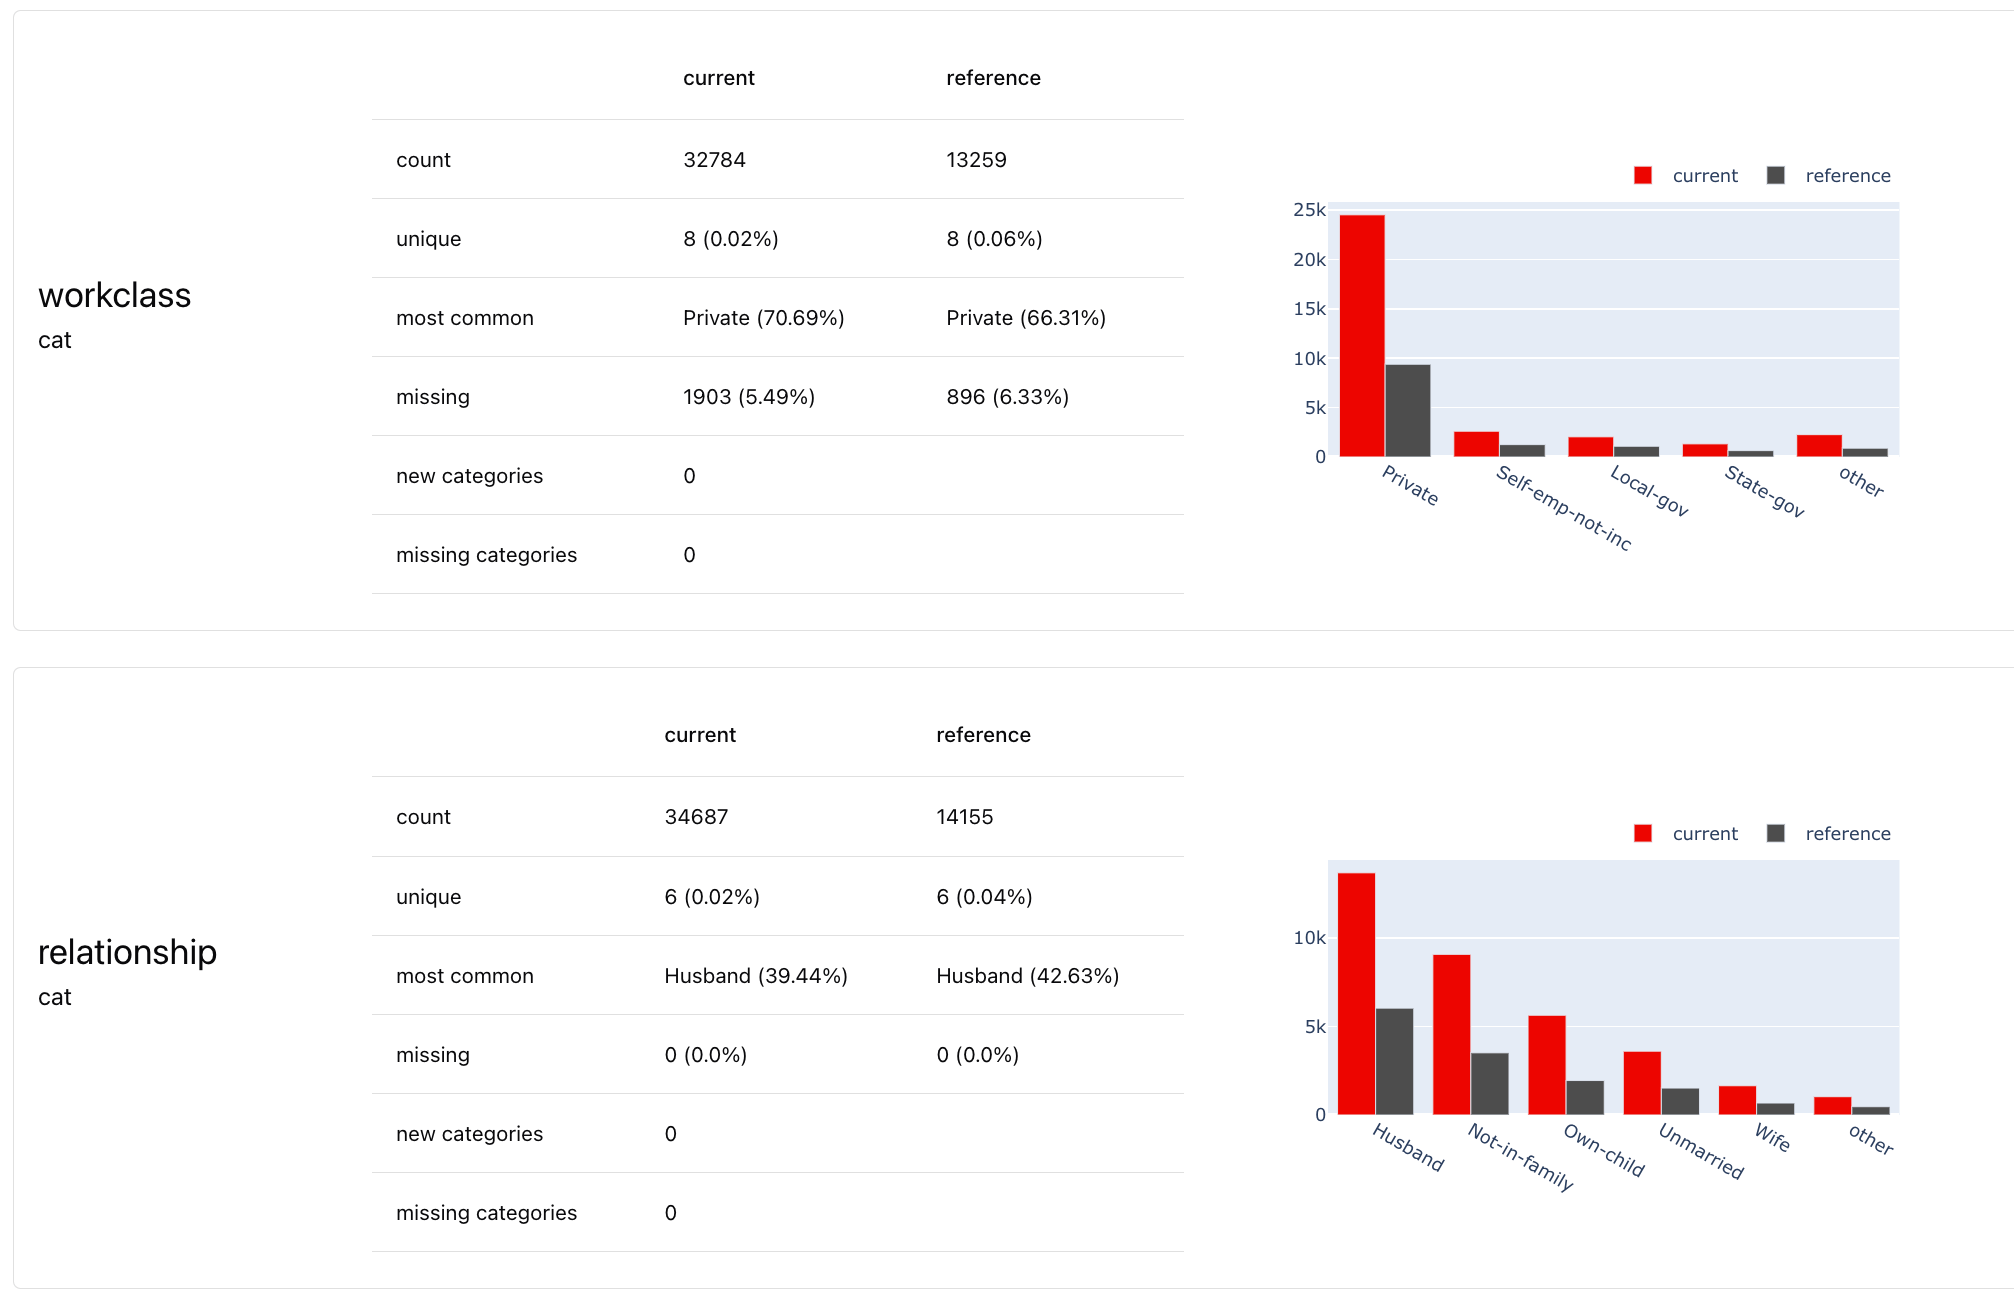 * **Dataset stats.** Shows stats like number of rows/columns, empty columns/rows, etc.
* **Column stats**. Shows relevant statistics and visualizes distribution for each column. The stats are different based on the column type (numerical, categorical, text, datetime).
**Test suite**. If you choose to enable Tests, you will get an additional Test Suite view:
* **Dataset stats.** Shows stats like number of rows/columns, empty columns/rows, etc.
* **Column stats**. Shows relevant statistics and visualizes distribution for each column. The stats are different based on the column type (numerical, categorical, text, datetime).
**Test suite**. If you choose to enable Tests, you will get an additional Test Suite view:
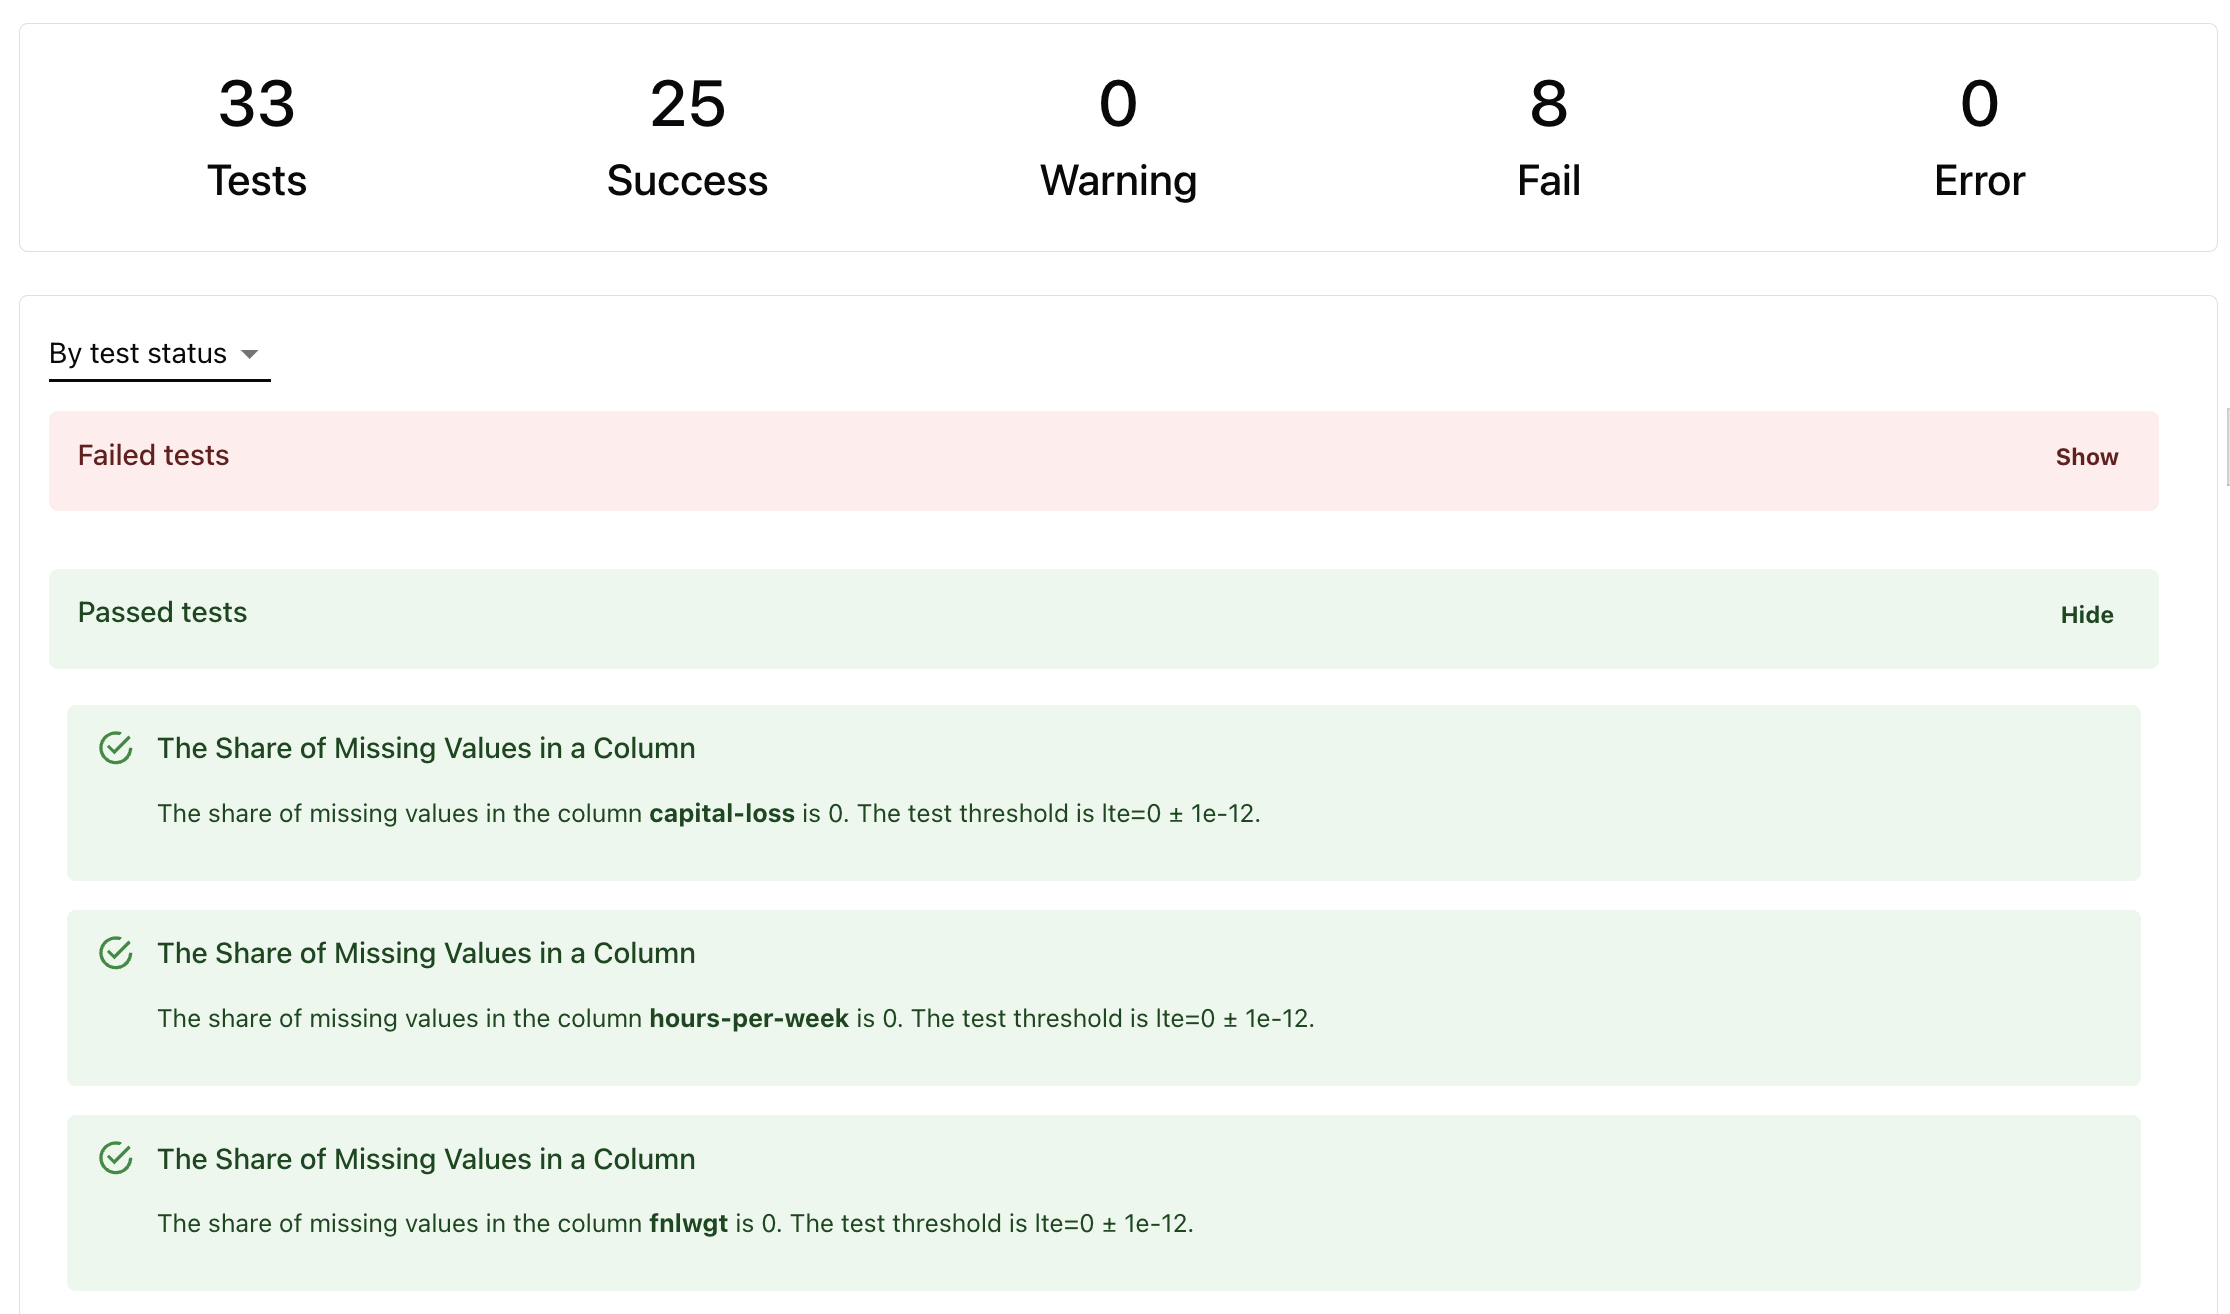 Tests are auto-generated:
* **Based on reference dataset.** If the reference dataset is provided, conditions like min-max feature ranges are derived directly from it.
* **Based on heuristics.** If there is no reference, some Tests will run with heuristics (like expect no missing values).
**How Tests work.** Read about [Tests](/docs/library/tests) and check defaults for each Test in the [reference table.](/metrics/all_metrics)
## Use case
You can use this Preset in different scenarios.
* **Exploratory data analysis.** Use the visual Report to explore your dataset at any point (during model training, after new batch of data arrives, during debugging etc.)
* **Dataset comparison.** Compare any datasets to understand the differences: training and test dataset, subgroups in the same dataset, current production data against training, etc..
* **Data quality tests in production.** By enabling Tests, you can check the quality and stability of the input data before you generate the predictions, every time you perform a certain transformation, add a new data source, etc.
* **Data profiling in production.** You can use this preset during monitoring to capture the shape of the production data for future analysis and visualization.
## Data requirements
* **Input columns**. You can provide any input columns. They must be non-empty.
* **One or two datasets**. Pass two for a side-by-side comparison or to auto-generate tests.
* (Optional) **Set column types.** The Preset evaluates numerical, categorical, text and DateTime columns. You can specify column types explicitly (recommended). Otherwise Evidently will auto-detect numerical, categorical and datetime columns. You must always map text data.
**Data schema mapping**. Use the [data definition](/docs/library/data_definition) to map your input data.
## Report customization
You have multiple customization options.
**Select columns**. You can get stats only for some columns in the Dataset. Use the `columns` parameter.
**Modify Report composition**. You can add other Metrics to the Report to get a more comprehensive evaluation. Here are some recommended options.
* **Correlations.** Add correlations heatmap.
* **Missing values.** Add missing values heatmap.
* **Data drift**. Evaluate the distribution shifts if you have two datasets.
**Customize Test conditions**. To modify the auto-generated Test conditions, you can set yours: either a different condition relative to the reference or any custom conditions per each Test.
**Custom Report**. Check how to create a [Report](/docs/library/report) and add [Tests](/docs/library/tests) conditions.
Tests are auto-generated:
* **Based on reference dataset.** If the reference dataset is provided, conditions like min-max feature ranges are derived directly from it.
* **Based on heuristics.** If there is no reference, some Tests will run with heuristics (like expect no missing values).
**How Tests work.** Read about [Tests](/docs/library/tests) and check defaults for each Test in the [reference table.](/metrics/all_metrics)
## Use case
You can use this Preset in different scenarios.
* **Exploratory data analysis.** Use the visual Report to explore your dataset at any point (during model training, after new batch of data arrives, during debugging etc.)
* **Dataset comparison.** Compare any datasets to understand the differences: training and test dataset, subgroups in the same dataset, current production data against training, etc..
* **Data quality tests in production.** By enabling Tests, you can check the quality and stability of the input data before you generate the predictions, every time you perform a certain transformation, add a new data source, etc.
* **Data profiling in production.** You can use this preset during monitoring to capture the shape of the production data for future analysis and visualization.
## Data requirements
* **Input columns**. You can provide any input columns. They must be non-empty.
* **One or two datasets**. Pass two for a side-by-side comparison or to auto-generate tests.
* (Optional) **Set column types.** The Preset evaluates numerical, categorical, text and DateTime columns. You can specify column types explicitly (recommended). Otherwise Evidently will auto-detect numerical, categorical and datetime columns. You must always map text data.
**Data schema mapping**. Use the [data definition](/docs/library/data_definition) to map your input data.
## Report customization
You have multiple customization options.
**Select columns**. You can get stats only for some columns in the Dataset. Use the `columns` parameter.
**Modify Report composition**. You can add other Metrics to the Report to get a more comprehensive evaluation. Here are some recommended options.
* **Correlations.** Add correlations heatmap.
* **Missing values.** Add missing values heatmap.
* **Data drift**. Evaluate the distribution shifts if you have two datasets.
**Customize Test conditions**. To modify the auto-generated Test conditions, you can set yours: either a different condition relative to the reference or any custom conditions per each Test.
**Custom Report**. Check how to create a [Report](/docs/library/report) and add [Tests](/docs/library/tests) conditions.