> ## Documentation Index
> Fetch the complete documentation index at: https://docs.evidentlyai.com/llms.txt
> Use this file to discover all available pages before exploring further.
# Classification
> Overview of the Classification Quality Preset
**Pre-requisites**:
* You know how to use [Data Definition ](/docs/library/data_definition)to prepare the data.
* You know how to create [Reports](/docs/library/report).
**Report.** To run a Preset on your data for a single current dataset:
```python theme={null}
report = Report([
ClassificationPreset(),
])
my_eval = report.run(current, None)
```
**Test Suite**. To add pass/fail classification quality Tests, auto-generated from the `ref` dataset:
```python theme={null}
report = Report([
ClassificationPreset(),
],
include_tests=True)
my_eval = report.run(current, ref)
```
# Overview
The `ClassificationPreset` allows you to evaluate and visualize the performance on classification tasks, whether binary or multi-class. You can run this Report either for a single dataset or compare it against a reference dataset (such as past performance, or a different model/prompt).
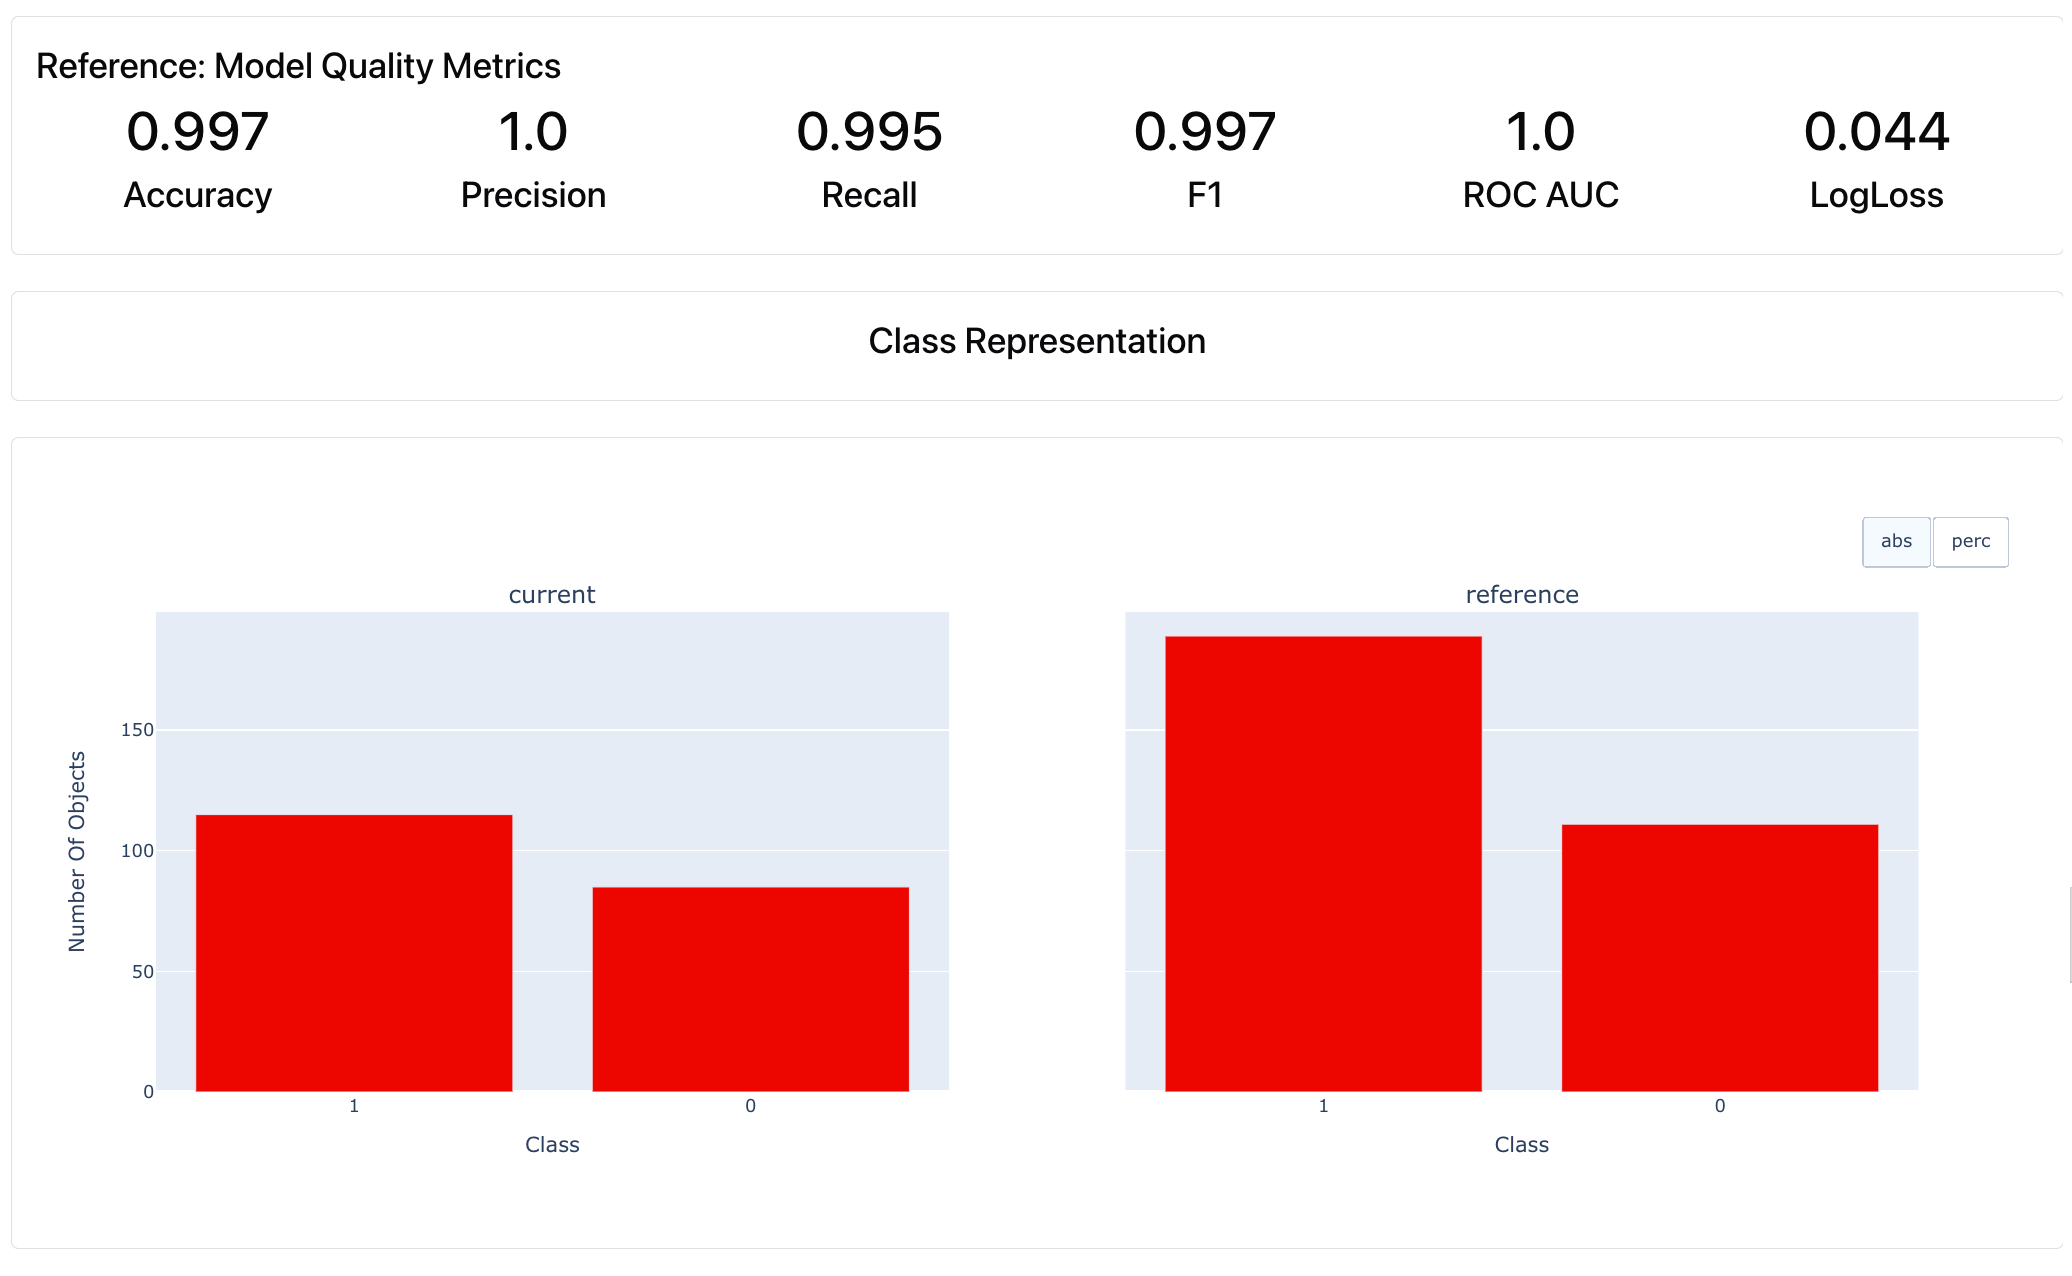 * **Various metrics**: Accuracy, Precision, Recall, F1-score, ROC AUC, LogLoss, etc.
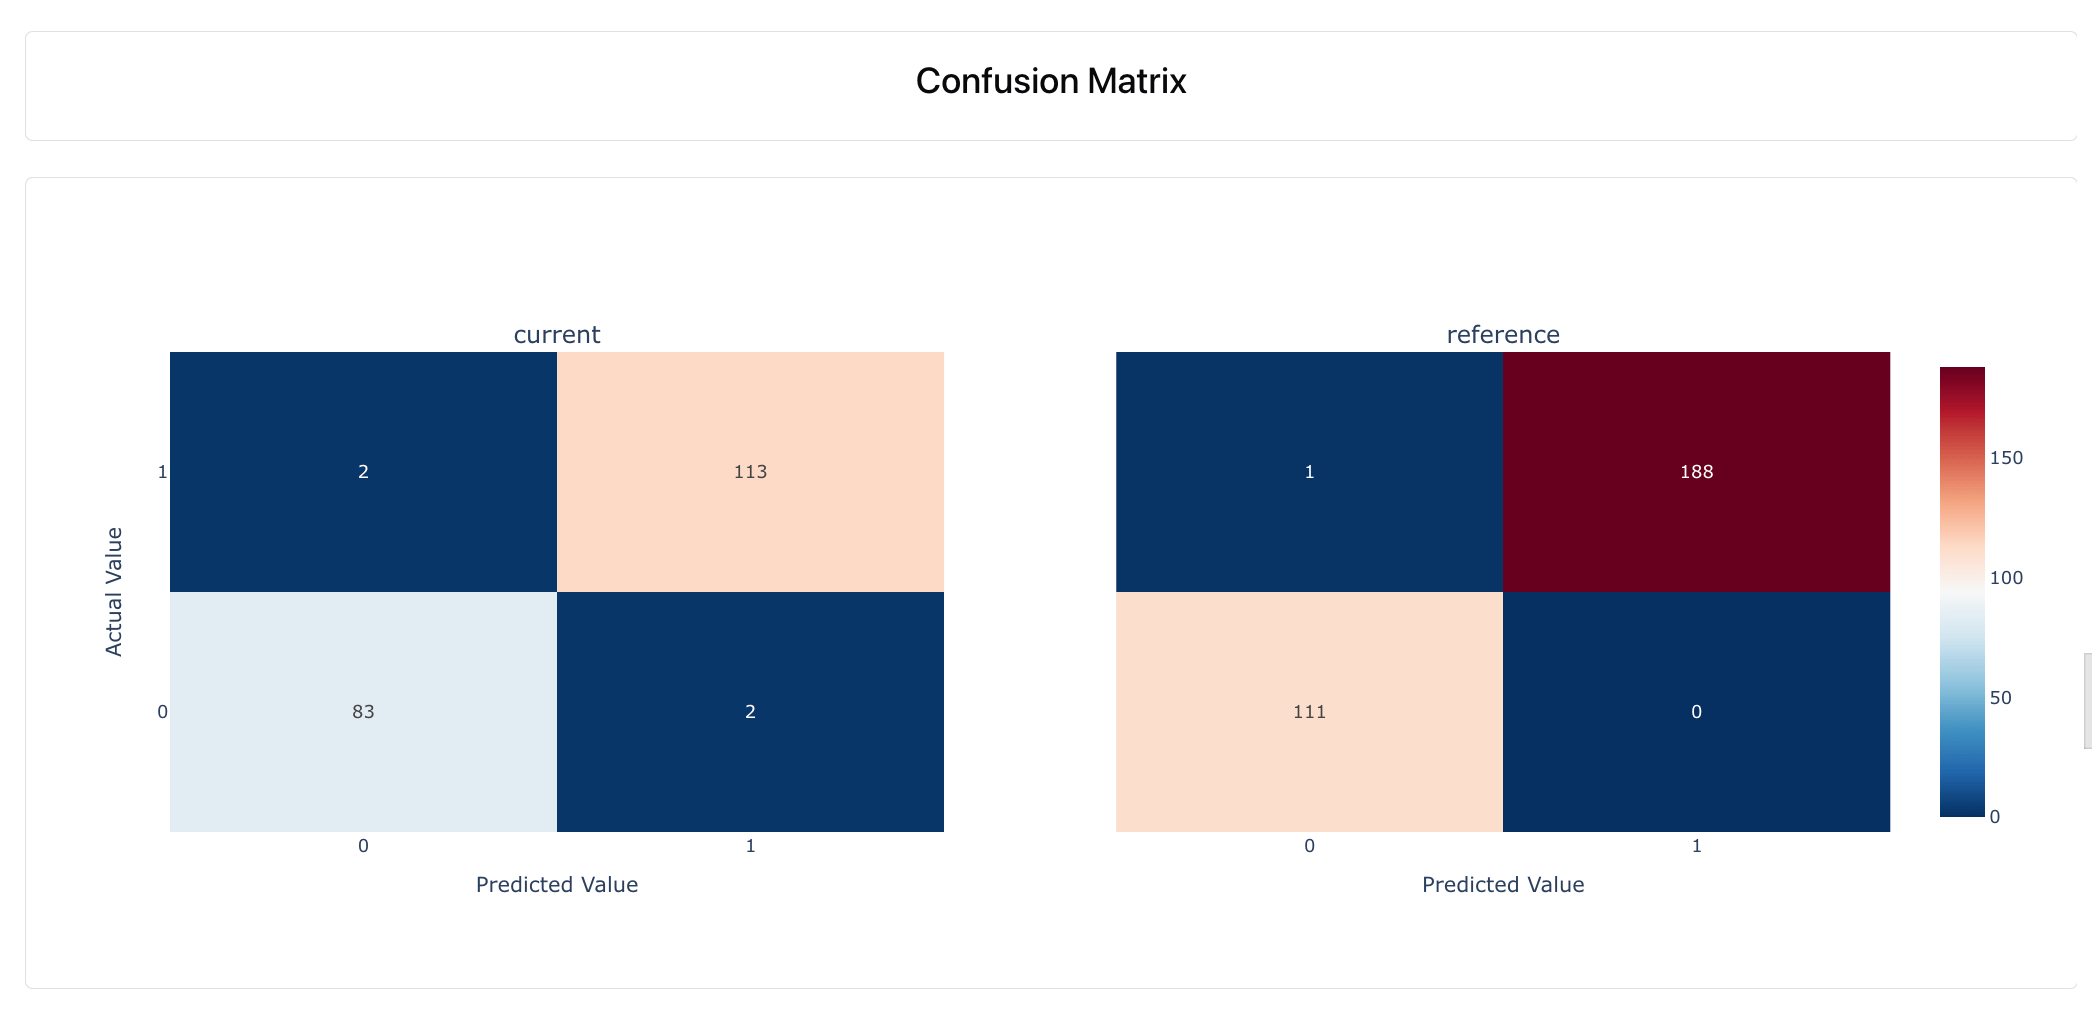
* **Various visualizations**: Class Representation, Confusion Matrix, Class Separation Quality, Probability Distribution, ROC Curve, PR Curve, etc.
* **Various metrics**: Accuracy, Precision, Recall, F1-score, ROC AUC, LogLoss, etc.
* **Various visualizations**: Class Representation, Confusion Matrix, Class Separation Quality, Probability Distribution, ROC Curve, PR Curve, etc.
 Additionally, if you include feature columns, the Report will show Classification Quality by column. It displays the relationship between columns/features and the target, showing how the system performs on different data segments.
**Test Suite**. If you enable Tests, this will automatically run checks to assess if the model performance metrics are within bounds.
Additionally, if you include feature columns, the Report will show Classification Quality by column. It displays the relationship between columns/features and the target, showing how the system performs on different data segments.
**Test Suite**. If you enable Tests, this will automatically run checks to assess if the model performance metrics are within bounds.
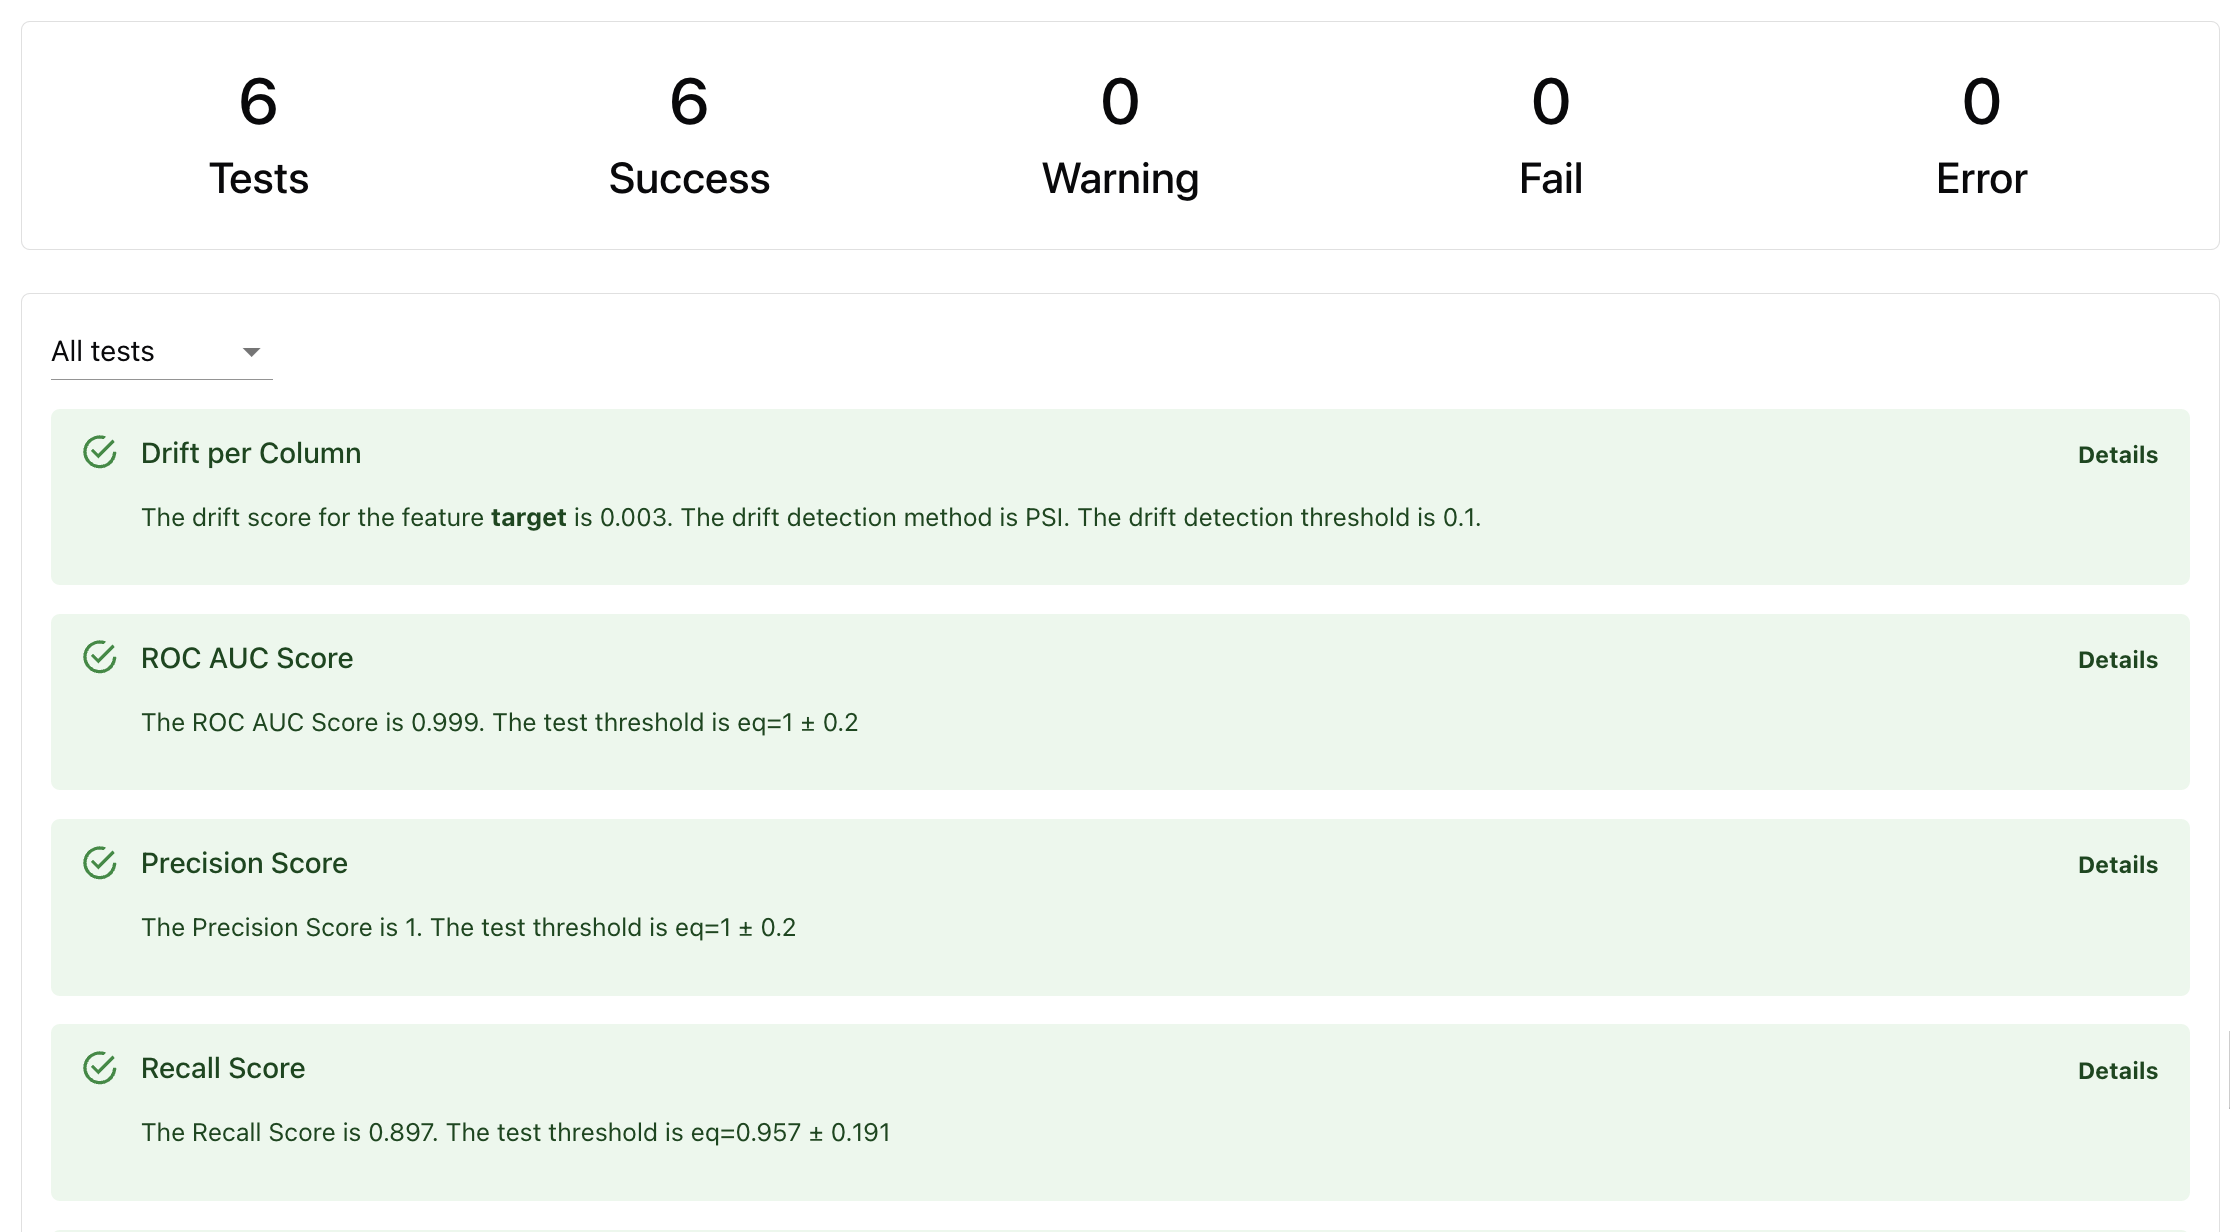 Tests are auto-generated:
* **Based on reference dataset.** If the reference dataset is provided, conditions like expected prediction accuracy will be derived from it.
* **Based on heuristics.** If there is no reference, Evidently will create a dummy classification model as a baseline and run checks against it.
**How Tests work.** Read about [Tests](/docs/library/tests) and check defaults for each Test in the [reference table.](/metrics/all_metrics)
## Use case
These Presets are useful in various scenarios:
* **Model / system comparison**. Compare predictive system performance across different datasets, such as during A/B testing, when experimenting with different prompt versions and configurations, etc.
* **Production monitoring**. You can run evaluations whenever you get true labels in production. Use this to communicate and visualize performance, decide on model updates / retraining, etc.
* **Debugging**. If you notice a drop in performance, use the visual Report
Model Monitoring: Track the performance of a classification model over time to diagnose quality issues, explore the model errors and underperforming segments.
## Data requirements
* **Target and prediction columns**. Required to calculate performance.
* **One or two datasets**. Pass two for a side-by-side comparison or to auto-generate tests.
* (Optional) **Input features.** Include if you want to explore column-target relations.
* (Optional) **Timestamp**. If available, pass it to appear on some plots.
**Data schema mapping.** Use the [data definition](/docs/library/data_definition) to map your data structure.
## Report Customization
You can customize the Report in several ways:
* **Change Test conditions**. To modify the auto-generated conditions, you can set yours: either a different condition relative to the reference or any custom conditions.
* **Modify Report composition**. You can add additional metrics, such as column Correlations, Missing Values, or Data Drift. It's often useful to add `ValueDrift("target")`to evaluate if there is a statistical distribution shift in the model target (concept drift).
**Creating a custom Report**. Check the documentation for creating a [custom Report](/docs/library/report) and modifying [Tests](/docs/library/tests) conditions.
Tests are auto-generated:
* **Based on reference dataset.** If the reference dataset is provided, conditions like expected prediction accuracy will be derived from it.
* **Based on heuristics.** If there is no reference, Evidently will create a dummy classification model as a baseline and run checks against it.
**How Tests work.** Read about [Tests](/docs/library/tests) and check defaults for each Test in the [reference table.](/metrics/all_metrics)
## Use case
These Presets are useful in various scenarios:
* **Model / system comparison**. Compare predictive system performance across different datasets, such as during A/B testing, when experimenting with different prompt versions and configurations, etc.
* **Production monitoring**. You can run evaluations whenever you get true labels in production. Use this to communicate and visualize performance, decide on model updates / retraining, etc.
* **Debugging**. If you notice a drop in performance, use the visual Report
Model Monitoring: Track the performance of a classification model over time to diagnose quality issues, explore the model errors and underperforming segments.
## Data requirements
* **Target and prediction columns**. Required to calculate performance.
* **One or two datasets**. Pass two for a side-by-side comparison or to auto-generate tests.
* (Optional) **Input features.** Include if you want to explore column-target relations.
* (Optional) **Timestamp**. If available, pass it to appear on some plots.
**Data schema mapping.** Use the [data definition](/docs/library/data_definition) to map your data structure.
## Report Customization
You can customize the Report in several ways:
* **Change Test conditions**. To modify the auto-generated conditions, you can set yours: either a different condition relative to the reference or any custom conditions.
* **Modify Report composition**. You can add additional metrics, such as column Correlations, Missing Values, or Data Drift. It's often useful to add `ValueDrift("target")`to evaluate if there is a statistical distribution shift in the model target (concept drift).
**Creating a custom Report**. Check the documentation for creating a [custom Report](/docs/library/report) and modifying [Tests](/docs/library/tests) conditions.