> ## Documentation Index
> Fetch the complete documentation index at: https://docs.evidentlyai.com/llms.txt
> Use this file to discover all available pages before exploring further.
# LLM regression testing
> How to run regression testing for LLM outputs.
In this tutorial, you will learn how to perform regression testing for LLM outputs.
You can compare new and old responses after changing a prompt, model, or anything else in your system. By re-running the same inputs with new parameters, you can spot any significant changes. This helps you push updates with confidence or identify issues to fix.
**This example uses Evidently Cloud.** You'll run evals in Python and upload them. You can also skip the upload and view Reports locally. For self-hosted, replace `CloudWorkspace` with `Workspace`.
# Tutorial scope
Here's what we'll do:
* **Create a toy dataset**. Build a small Q\&A dataset with answers and reference responses.
* **Get new answers**. Imitate generating new answers to the same question.
* **Create and run a Report with Tests**. Compare the answers using LLM-as-a-judge to evaluate length, correctness and style consistency.
* **Build a monitoring Dashboard**. Get plots to track the results of Tests over time.
To simplify things, we won't create an actual LLM app, but will simulate generating new outputs.
To complete the tutorial, you will need:
* Basic Python knowledge.
* An OpenAI API key to use for the LLM evaluator.
* An Evidently Cloud account to track test results. If not yet, [sign up](https://www.evidentlyai.com/register) for a free account.
You can see all the code in [Jupyter notebook](https://github.com/evidentlyai/community-examples/blob/main/tutorials/Regression_testing_with_debugging_updated.ipynb) or click to [open in Colab](https://colab.research.google.com/github/evidentlyai/community-examples/blob/main/tutorials/Regression_testing_with_debugging_updated.ipynb).
## 1. Installation and Imports
Install Evidently:
```python theme={null}
pip install evidently[llm]
```
Import the required modules:
```python theme={null}
import pandas as pd
from evidently.future.datasets import Dataset
from evidently.future.datasets import DataDefinition
from evidently.future.datasets import Descriptor
from evidently.future.descriptors import *
from evidently.future.report import Report
from evidently.future.presets import TextEvals
from evidently.future.metrics import *
from evidently.future.tests import *
from evidently.features.llm_judge import BinaryClassificationPromptTemplate
```
To connect to Evidently Cloud:
```python theme={null}
from evidently.ui.workspace.cloud import CloudWorkspace
```
**Optional.** To create monitoring panels as code:
```python theme={null}
from evidently.ui.dashboards import DashboardPanelPlot
from evidently.ui.dashboards import DashboardPanelTestSuite
from evidently.ui.dashboards import DashboardPanelTestSuiteCounter
from evidently.ui.dashboards import TestSuitePanelType
from evidently.ui.dashboards import ReportFilter
from evidently.ui.dashboards import PanelValue
from evidently.ui.dashboards import PlotType
from evidently.ui.dashboards import CounterAgg
from evidently.tests.base_test import TestStatus
from evidently.renderers.html_widgets import WidgetSize
```
Pass your OpenAI key:
```python theme={null}
import os
os.environ["OPENAI_API_KEY"] = "YOUR KEY"
```
## 2. Create a Project
Connect to Evidently Cloud. Replace with your actual token:
```python theme={null}
ws = CloudWorkspace(token="YOUR_API_TOKEN", url="https://app.evidently.cloud")
```
Create a Project:
```python theme={null}
project = ws.create_project("Regression testing example", org_id="YOUR_ORG_ID")
project.description = "My project description"
project.save()
```
## 3. Prepare the Dataset
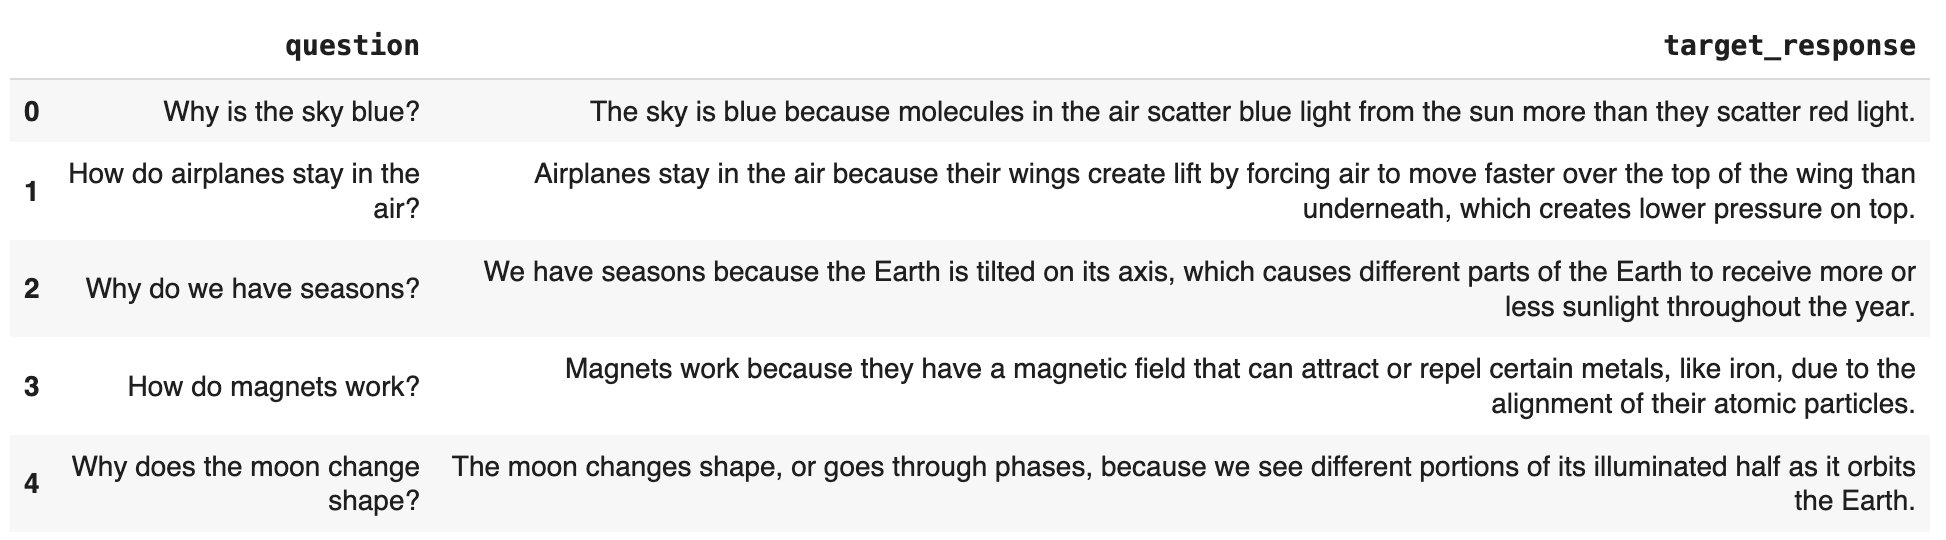
Create a toy dataset with questions and reference answers.
```python theme={null}
data = [
["Why is the sky blue?", "The sky is blue because molecules in the air scatter blue light from the sun more than they scatter red light."],
["How do airplanes stay in the air?", "Airplanes stay in the air because their wings create lift by forcing air to move faster over the top of the wing than underneath, which creates lower pressure on top."],
["Why do we have seasons?", "We have seasons because the Earth is tilted on its axis, which causes different parts of the Earth to receive more or less sunlight throughout the year."],
["How do magnets work?", "Magnets work because they have a magnetic field that can attract or repel certain metals, like iron, due to the alignment of their atomic particles."],
["Why does the moon change shape?", "The moon changes shape, or goes through phases, because we see different portions of its illuminated half as it orbits the Earth."]
]
columns = ["question", "target_response"]
ref_data = pd.DataFrame(data, columns=columns)
```
Get a quick preview:
```python theme={null}
pd.set_option('display.max_colwidth', None)
ref_data.head()
```
Here is how the data looks:
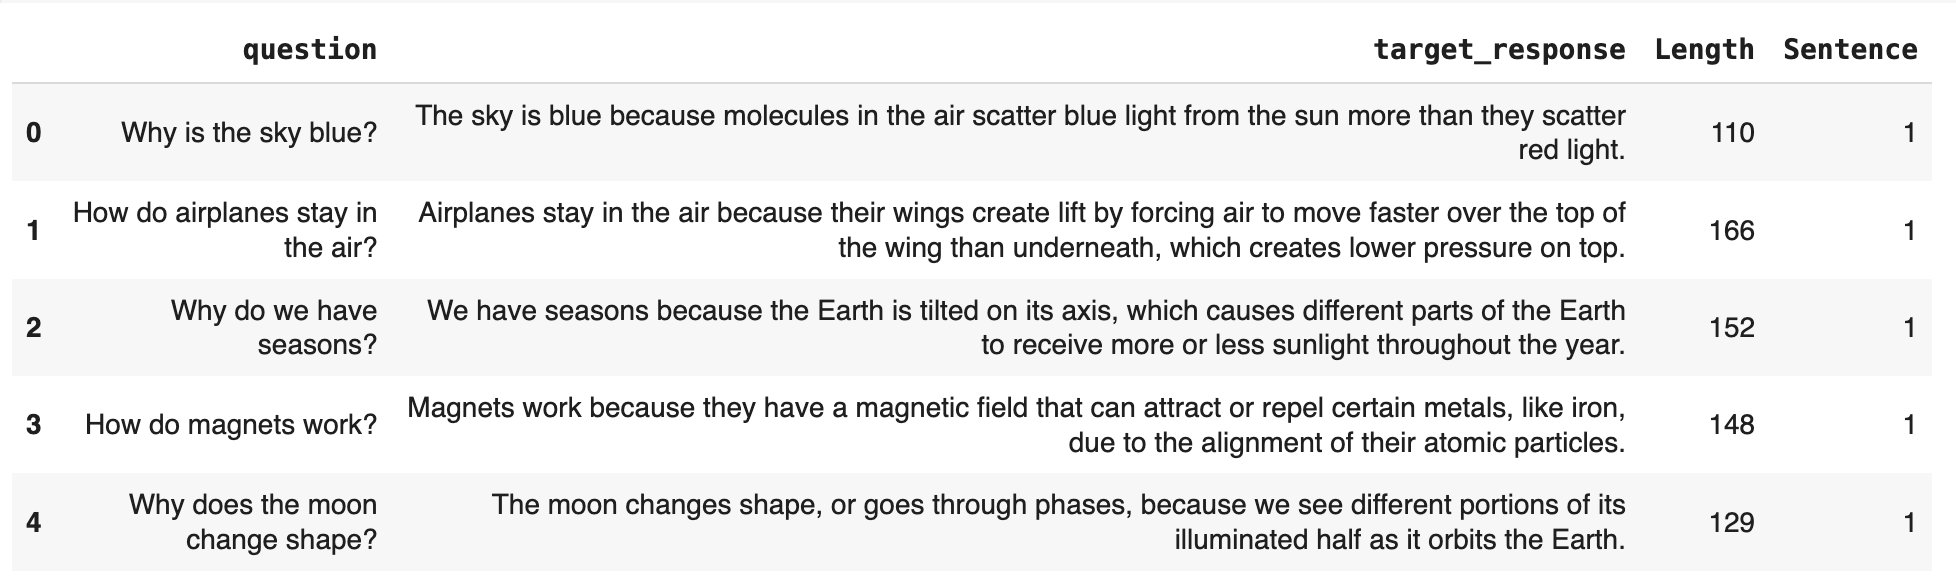
 **Optional: quick data exploration.** You might want to have a quick look at some data statistics to help you set conditions for Tests. Let's check the text length and sentence count distribution.
```python theme={null}
ref_dataset = Dataset.from_pandas(pd.DataFrame(ref_data),
data_definition=DataDefinition(),
descriptors=[
TextLength("target_response", alias="Length"),
SentenceCount("target_response", alias="Sentence"),
])
ref_dataset.as_dataframe()
```
In this code, you:
* Created an Evidently Dataset object with automatic [data definition](/docs/library/data_definition).
* Added two built-in descriptors on text length and symbol count. ([See others](/metrics/all_descriptors)).
* Exported results as a dataframe.
Here is the preview:
**Optional: quick data exploration.** You might want to have a quick look at some data statistics to help you set conditions for Tests. Let's check the text length and sentence count distribution.
```python theme={null}
ref_dataset = Dataset.from_pandas(pd.DataFrame(ref_data),
data_definition=DataDefinition(),
descriptors=[
TextLength("target_response", alias="Length"),
SentenceCount("target_response", alias="Sentence"),
])
ref_dataset.as_dataframe()
```
In this code, you:
* Created an Evidently Dataset object with automatic [data definition](/docs/library/data_definition).
* Added two built-in descriptors on text length and symbol count. ([See others](/metrics/all_descriptors)).
* Exported results as a dataframe.
Here is the preview:
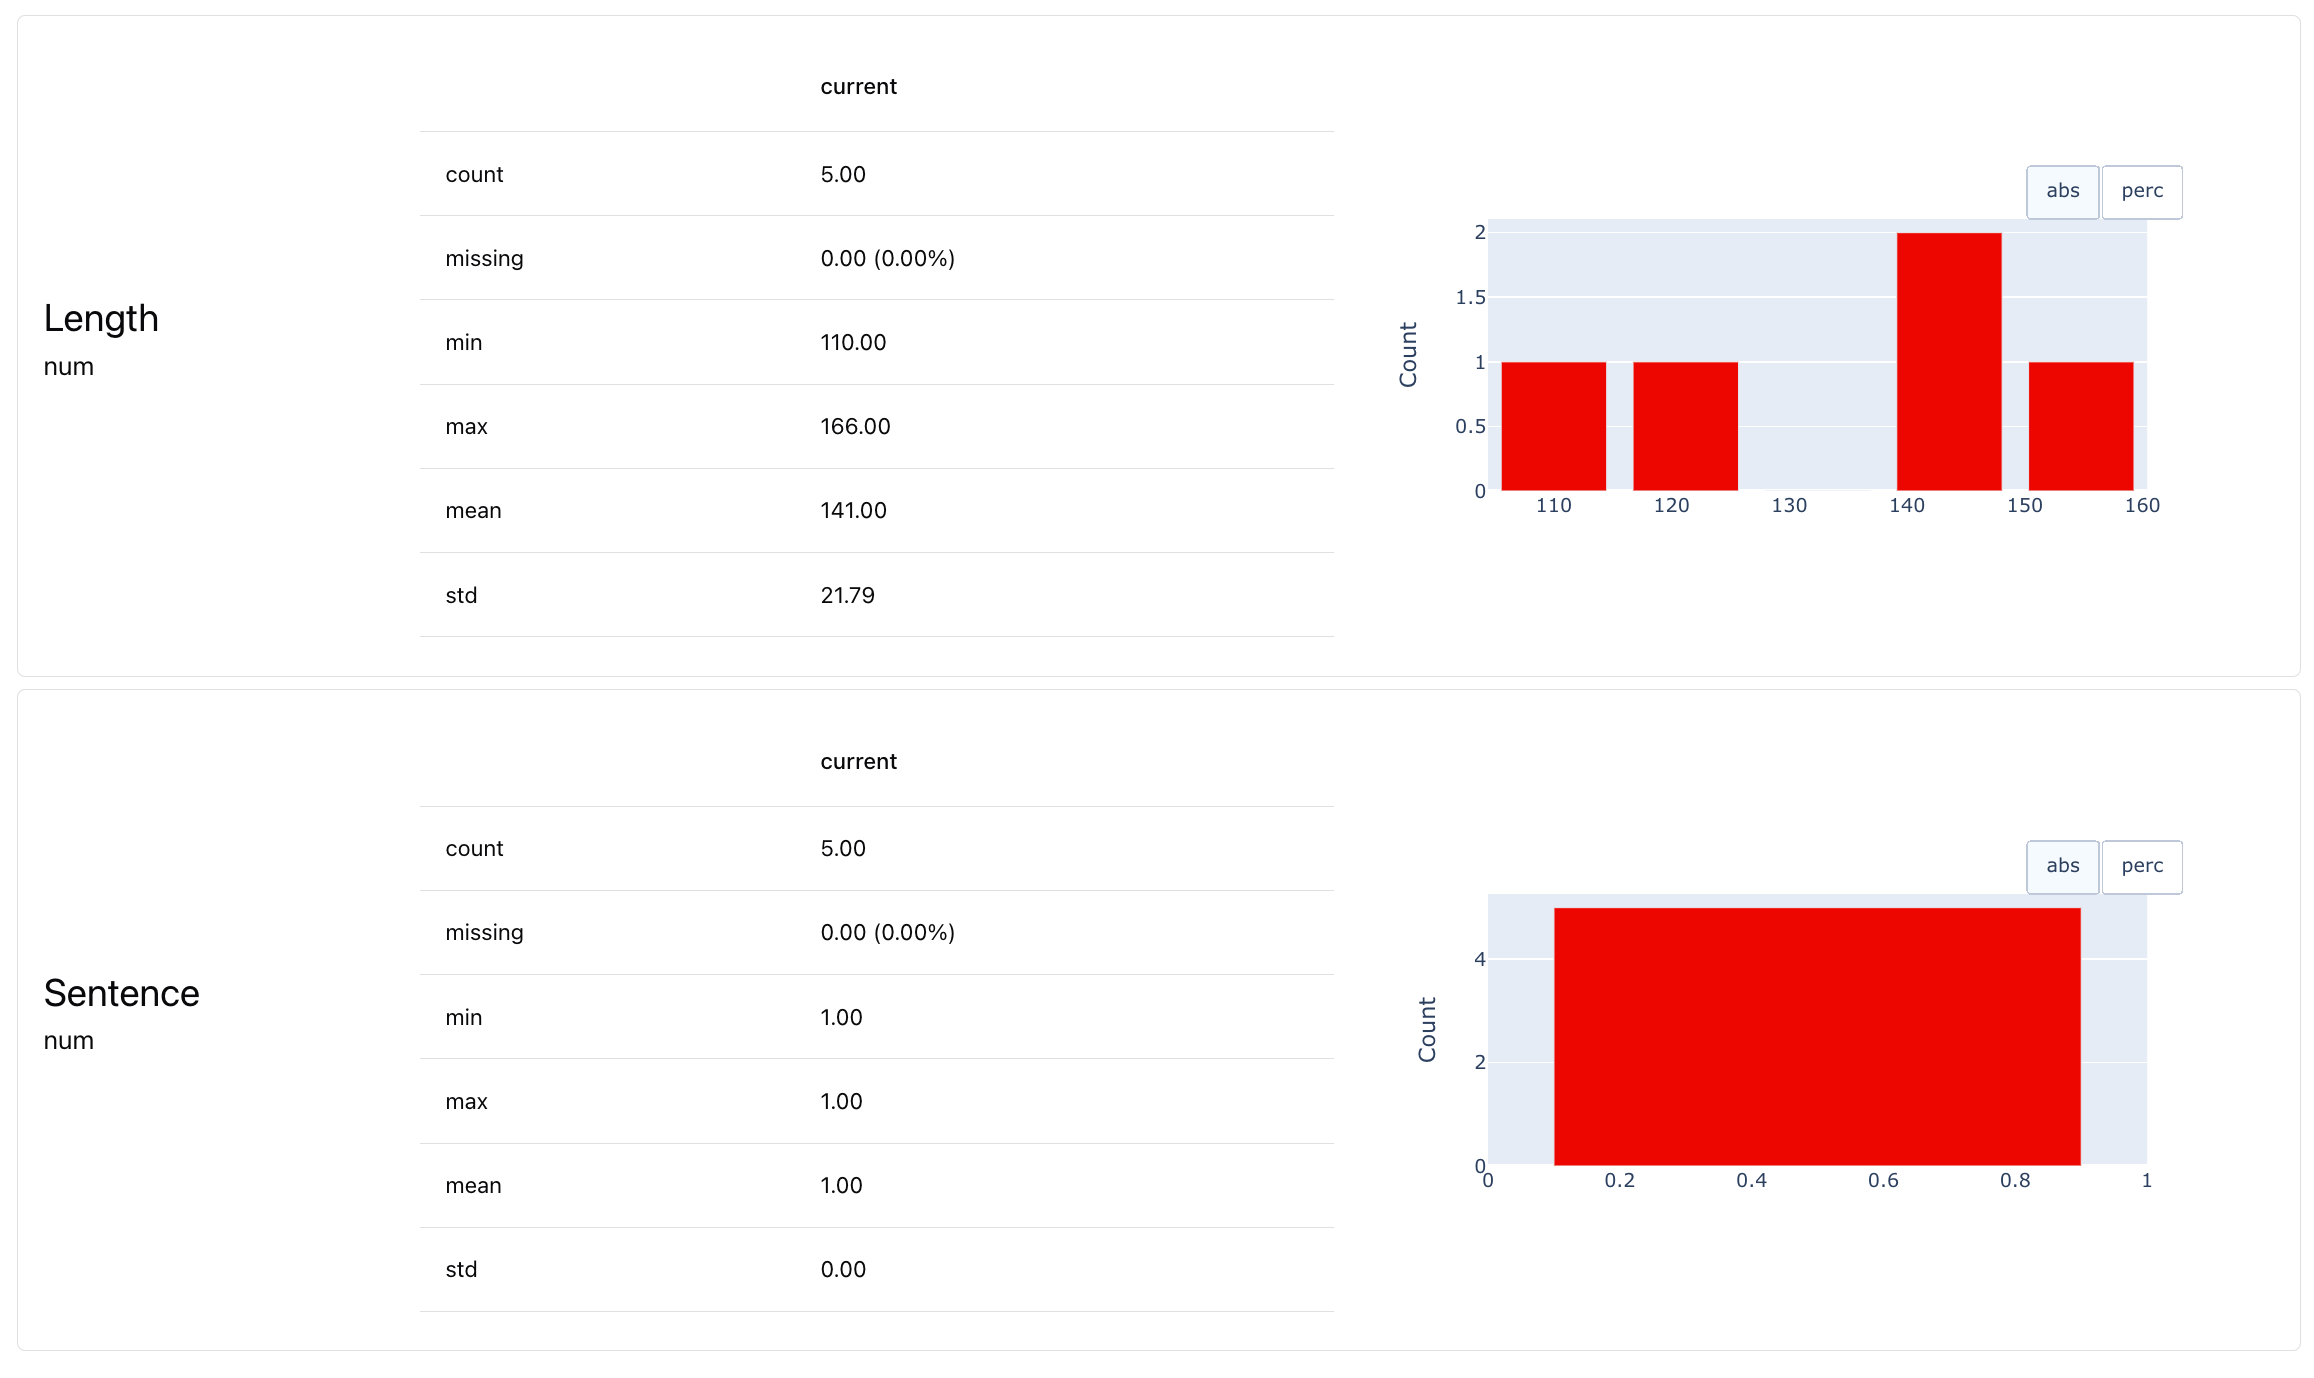
 In a small dataset, you can grasp it all at once. For a larger dataset, you can add a summary report to see the distribution.
```python theme={null}
report = Report([
TextEvals(),
])
my_eval = report.run(ref_dataset, None)
my_eval
#my_eval.as_dict()
#my_eval.json()
```
This renders the Report directly in the interactive Python environment like Jupyter notebook or Colab. See other [export options](/docs/library/output_formats).
In a small dataset, you can grasp it all at once. For a larger dataset, you can add a summary report to see the distribution.
```python theme={null}
report = Report([
TextEvals(),
])
my_eval = report.run(ref_dataset, None)
my_eval
#my_eval.as_dict()
#my_eval.json()
```
This renders the Report directly in the interactive Python environment like Jupyter notebook or Colab. See other [export options](/docs/library/output_formats).
 ## 4. Get new answers
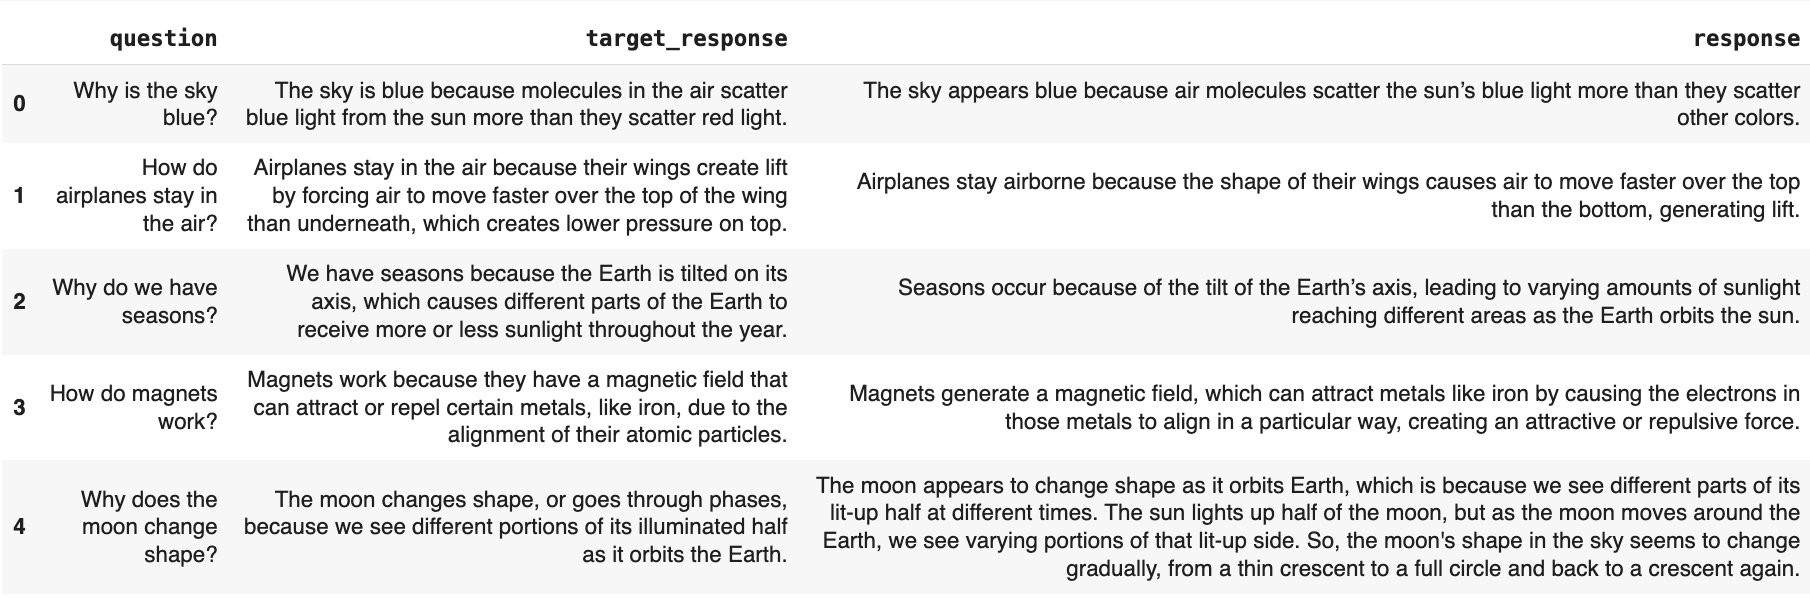
Suppose you generate new responses using your LLM after changing a prompt. We will imitate it by adding a new column with new responses to the DataFrame:
Run this code to generate a new dataset.
```python theme={null}
data = [
["Why is the sky blue?",
"The sky is blue because molecules in the air scatter blue light from the sun more than they scatter red light.",
"The sky appears blue because air molecules scatter the sun’s blue light more than they scatter other colors."],
["How do airplanes stay in the air?",
"Airplanes stay in the air because their wings create lift by forcing air to move faster over the top of the wing than underneath, which creates lower pressure on top.",
"Airplanes stay airborne because the shape of their wings causes air to move faster over the top than the bottom, generating lift."],
["Why do we have seasons?",
"We have seasons because the Earth is tilted on its axis, which causes different parts of the Earth to receive more or less sunlight throughout the year.",
"Seasons occur because of the tilt of the Earth’s axis, leading to varying amounts of sunlight reaching different areas as the Earth orbits the sun."],
["How do magnets work?",
"Magnets work because they have a magnetic field that can attract or repel certain metals, like iron, due to the alignment of their atomic particles.",
"Magnets generate a magnetic field, which can attract metals like iron by causing the electrons in those metals to align in a particular way, creating an attractive or repulsive force."],
["Why does the moon change shape?",
"The moon changes shape, or goes through phases, because we see different portions of its illuminated half as it orbits the Earth.",
"The moon appears to change shape as it orbits Earth, which is because we see different parts of its lit-up half at different times. The sun lights up half of the moon, but as the moon moves around the Earth, we see varying portions of that lit-up side. So, the moon's shape in the sky seems to change gradually, from a thin crescent to a full circle and back to a crescent again."]
]
columns = ["question", "target_response", "response"]
eval_data = pd.DataFrame(data, columns=columns)
```
Here is the resulting dataset with the added new column:
## 4. Get new answers
Suppose you generate new responses using your LLM after changing a prompt. We will imitate it by adding a new column with new responses to the DataFrame:
Run this code to generate a new dataset.
```python theme={null}
data = [
["Why is the sky blue?",
"The sky is blue because molecules in the air scatter blue light from the sun more than they scatter red light.",
"The sky appears blue because air molecules scatter the sun’s blue light more than they scatter other colors."],
["How do airplanes stay in the air?",
"Airplanes stay in the air because their wings create lift by forcing air to move faster over the top of the wing than underneath, which creates lower pressure on top.",
"Airplanes stay airborne because the shape of their wings causes air to move faster over the top than the bottom, generating lift."],
["Why do we have seasons?",
"We have seasons because the Earth is tilted on its axis, which causes different parts of the Earth to receive more or less sunlight throughout the year.",
"Seasons occur because of the tilt of the Earth’s axis, leading to varying amounts of sunlight reaching different areas as the Earth orbits the sun."],
["How do magnets work?",
"Magnets work because they have a magnetic field that can attract or repel certain metals, like iron, due to the alignment of their atomic particles.",
"Magnets generate a magnetic field, which can attract metals like iron by causing the electrons in those metals to align in a particular way, creating an attractive or repulsive force."],
["Why does the moon change shape?",
"The moon changes shape, or goes through phases, because we see different portions of its illuminated half as it orbits the Earth.",
"The moon appears to change shape as it orbits Earth, which is because we see different parts of its lit-up half at different times. The sun lights up half of the moon, but as the moon moves around the Earth, we see varying portions of that lit-up side. So, the moon's shape in the sky seems to change gradually, from a thin crescent to a full circle and back to a crescent again."]
]
columns = ["question", "target_response", "response"]
eval_data = pd.DataFrame(data, columns=columns)
```
Here is the resulting dataset with the added new column:
 **How to connect it with your app?** Replace this step with calling your LLM app to score the inputs and add the new responses to the DataFrame. You can also use our **`tracely`** library to instrument your app and get traces as a tabular dataset. Check the tutorial with [tracing workflow](/quickstart_tracing).
## 5. Design the Test suite
To compare new answers with old ones, we need evaluation metrics. You can use deterministic or embeddings-based metrics like Semantic Similarity. However, you often need more custom criteria. Using **LLM-as-a-judge** is useful for this, letting you define what to detect.
Let’s formulate what we want to Tests:
* **Length check**. All new responses must be no longer than 200 symbols.
* **Correctness**. All new responses should not contradict the reference answer.
* **Style**. All new responses should match the style of the reference.
Text length is easy to check, but for Correctness and Style, we'll write our custom LLM judges.
### Correctness judge
We implement the correctness evaluator, using an Evidenty template for binary classification. We ask the LLM to classify each response as "correct" or "incorrect" based on the `target_response` column and provide reasoning for its decision.
You can also use a built-in `CorrectnessLLMEval()` to use a default prompt.
```python theme={null}
correctness = BinaryClassificationPromptTemplate(
criteria = """An ANSWER is correct when it is the same as the REFERENCE in all facts and details, even if worded differently.
The ANSWER is incorrect if it contradicts the REFERENCE, adds additional claims, omits or changes details.
REFERENCE:
=====
{target_response}
=====""",
target_category="incorrect",
non_target_category="correct",
uncertainty="unknown",
include_reasoning=True,
pre_messages=[("system", "You are an expert evaluator. You will be given an ANSWER and REFERENCE")],
)
```
We recommend splitting each evaluation criterion into separate judges and using a simple grading scale, like binary classifiers, for better reliability.
**Ideally, evaluate your judge first!** Each LLM evaluator is a small ML system you should align with your preferences. We recommend running a couple of iterations. Check the [tutorial on LLM judges](/examples/LLM_judge).
**Template parameters.** For an explanation of each parameter, check the [LLM judge ](/metrics/customize_llm_judge)docs.
### Style judge
Using a similar approach, we'll create a custom judge for style match: it should look whether the style (not the contents!) of both responses remains similar.
```python theme={null}
style_match = BinaryClassificationPromptTemplate(
criteria = """An ANSWER is style-matching when it matches the REFERENCE answer in STYLE, even if the meaning is different.
The ANSWER is style-mismatched when it diverges from the REFERENCE answer in STYLE, even if the meaning is the same.
Consider the following STYLE attributes:
- tone (friendly, formal, casual, sarcastic, etc.)
- sentence structure (simple, compound, complex, etc.)
- verbosity level (relative length of answers)
- and other similar attributes that may reflect difference in STYLE.
You must focus only on STYLE. Ignore any differences in contents.
=====
{target_response}
=====""",
target_category="style-mismatched",
non_target_category="style-matching",
uncertainty="unknown",
include_reasoning=True,
pre_messages=[("system", "You are an expert evaluator. You will be given an ANSWER and REFERENCE")],
)
```
This could be useful to detect more subtle changes, like LLM becoming suddenly more verbose.
At the same time, these types of checks are much more subjective and we can expect some variability in the judge responses, so we can treat this test as "non-critical".
## 6. Run the evaluation
Now, we can run tests that evaluate for correctness, style and text length. We do this in two steps.
**Score the data**. First, we define the row-level [descriptors](/docs/library/descriptors) we want to add. They will process each individual response and add the score/label to the dataset.
We'll include the two evaluators we just created, and built-in `TextLength()` descriptor.
```python theme={null}
descriptors=[LLMEval("response",
template=correctness,
provider = "openai",
model = "gpt-4o-mini",
alias="Correctness",
additional_columns={"target_response": "target_response"}),
LLMEval("response",
template=style_match,
provider = "openai",
model = "gpt-4o-mini",
alias="Style",
additional_columns={"target_response": "target_response"}),
TextLength("response", alias="Length")]
```
**Understand Descriptors**. See the list of other built-in [descriptors](/metrics/all_descriptors).
To add these descriptors to the dataset, run:
```python theme={null}
eval_dataset.add_descriptors(descriptors=descriptors)
```
To preview the results of this step locally:
```python theme={null}
eval_dataset.as_dataframe()
```
**How to connect it with your app?** Replace this step with calling your LLM app to score the inputs and add the new responses to the DataFrame. You can also use our **`tracely`** library to instrument your app and get traces as a tabular dataset. Check the tutorial with [tracing workflow](/quickstart_tracing).
## 5. Design the Test suite
To compare new answers with old ones, we need evaluation metrics. You can use deterministic or embeddings-based metrics like Semantic Similarity. However, you often need more custom criteria. Using **LLM-as-a-judge** is useful for this, letting you define what to detect.
Let’s formulate what we want to Tests:
* **Length check**. All new responses must be no longer than 200 symbols.
* **Correctness**. All new responses should not contradict the reference answer.
* **Style**. All new responses should match the style of the reference.
Text length is easy to check, but for Correctness and Style, we'll write our custom LLM judges.
### Correctness judge
We implement the correctness evaluator, using an Evidenty template for binary classification. We ask the LLM to classify each response as "correct" or "incorrect" based on the `target_response` column and provide reasoning for its decision.
You can also use a built-in `CorrectnessLLMEval()` to use a default prompt.
```python theme={null}
correctness = BinaryClassificationPromptTemplate(
criteria = """An ANSWER is correct when it is the same as the REFERENCE in all facts and details, even if worded differently.
The ANSWER is incorrect if it contradicts the REFERENCE, adds additional claims, omits or changes details.
REFERENCE:
=====
{target_response}
=====""",
target_category="incorrect",
non_target_category="correct",
uncertainty="unknown",
include_reasoning=True,
pre_messages=[("system", "You are an expert evaluator. You will be given an ANSWER and REFERENCE")],
)
```
We recommend splitting each evaluation criterion into separate judges and using a simple grading scale, like binary classifiers, for better reliability.
**Ideally, evaluate your judge first!** Each LLM evaluator is a small ML system you should align with your preferences. We recommend running a couple of iterations. Check the [tutorial on LLM judges](/examples/LLM_judge).
**Template parameters.** For an explanation of each parameter, check the [LLM judge ](/metrics/customize_llm_judge)docs.
### Style judge
Using a similar approach, we'll create a custom judge for style match: it should look whether the style (not the contents!) of both responses remains similar.
```python theme={null}
style_match = BinaryClassificationPromptTemplate(
criteria = """An ANSWER is style-matching when it matches the REFERENCE answer in STYLE, even if the meaning is different.
The ANSWER is style-mismatched when it diverges from the REFERENCE answer in STYLE, even if the meaning is the same.
Consider the following STYLE attributes:
- tone (friendly, formal, casual, sarcastic, etc.)
- sentence structure (simple, compound, complex, etc.)
- verbosity level (relative length of answers)
- and other similar attributes that may reflect difference in STYLE.
You must focus only on STYLE. Ignore any differences in contents.
=====
{target_response}
=====""",
target_category="style-mismatched",
non_target_category="style-matching",
uncertainty="unknown",
include_reasoning=True,
pre_messages=[("system", "You are an expert evaluator. You will be given an ANSWER and REFERENCE")],
)
```
This could be useful to detect more subtle changes, like LLM becoming suddenly more verbose.
At the same time, these types of checks are much more subjective and we can expect some variability in the judge responses, so we can treat this test as "non-critical".
## 6. Run the evaluation
Now, we can run tests that evaluate for correctness, style and text length. We do this in two steps.
**Score the data**. First, we define the row-level [descriptors](/docs/library/descriptors) we want to add. They will process each individual response and add the score/label to the dataset.
We'll include the two evaluators we just created, and built-in `TextLength()` descriptor.
```python theme={null}
descriptors=[LLMEval("response",
template=correctness,
provider = "openai",
model = "gpt-4o-mini",
alias="Correctness",
additional_columns={"target_response": "target_response"}),
LLMEval("response",
template=style_match,
provider = "openai",
model = "gpt-4o-mini",
alias="Style",
additional_columns={"target_response": "target_response"}),
TextLength("response", alias="Length")]
```
**Understand Descriptors**. See the list of other built-in [descriptors](/metrics/all_descriptors).
To add these descriptors to the dataset, run:
```python theme={null}
eval_dataset.add_descriptors(descriptors=descriptors)
```
To preview the results of this step locally:
```python theme={null}
eval_dataset.as_dataframe()
```
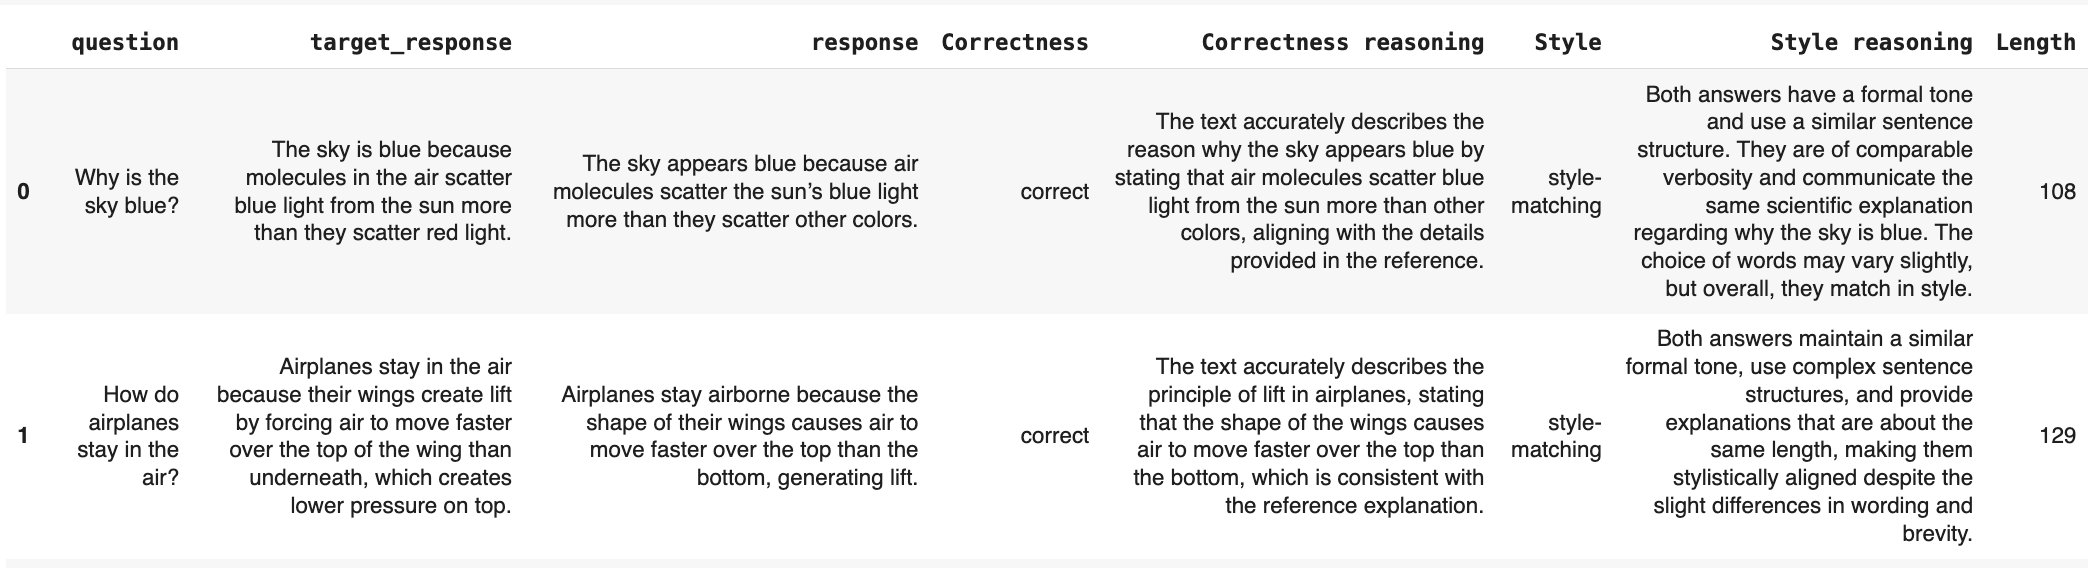 However, simply looking at the dataset is not very useful: we need to summarize the results and assess if the results are up to the mark. For that, we need a Report with the added tests.
**Create a Report**. Let's formulate the Report:
```python theme={null}
report = Report([
TextEvals(),
MaxValue(column="Length", tests=[lte(200)]),
CategoryCount(column="Correctness", category="incorrect", tests=[eq(0)]),
CategoryCount(column="Style", category="style-mismatched", tests=[eq(0, is_critical=False)]),
])
```
What happens in this code:
* We create an Evidently Report to compute aggregate Metrics.
* We use `TextEvals` to summarize all descriptors.
* We also add Tests for specific values we want to validate. You add Tests by picking a metric you want to assess, and adding a condition to it. (See [available Metrics](/metrics/all_metrics)).
* To set test conditions, you define the expectations using parameters like `gt` (greater than), `lt` (less than), `eq` (equal), etc. (Check [Test docs](/docs/library/tests)).
* We also label one of the tests (style match) as non-critical. This means it will trigger warning instead of a fail, and will be visually labeled yellow in the Report and the monitoring panel.
If you want to test share instead of count, use `share_tests` instead of `tests`.
**Run the Report**. Now that our Report with its test conditions is ready - let's run it! We will apply it to the `eval_dataset` that we prepared earlier, and send it to the Evidently Cloud.
```python theme={null}
my_eval = report.run(eval_dataset, None)
ws.add_run(project.id, my_eval, include_data=True)
```
Including data is optional but useful for most LLM use cases since you'd want to see not just the aggregate results but also the raw texts outputs.
You can preview the results in your Python notebook: call `my_eval` or `my_eval.json()`.
To view the results, navigate to the Evidently Platform. Go to the [Home Page](https://app.evidently.cloud/), enter your Project, and find the Reports section in the left menu. Here, you'll see the Report you can explore.
The Report will have two sections. Metrics show a summary or all values, and Tests will show the pass/fail results in the next tab. You will also see the Dataset with added scores and explanations.
Report view, with "Style" metric selected:
However, simply looking at the dataset is not very useful: we need to summarize the results and assess if the results are up to the mark. For that, we need a Report with the added tests.
**Create a Report**. Let's formulate the Report:
```python theme={null}
report = Report([
TextEvals(),
MaxValue(column="Length", tests=[lte(200)]),
CategoryCount(column="Correctness", category="incorrect", tests=[eq(0)]),
CategoryCount(column="Style", category="style-mismatched", tests=[eq(0, is_critical=False)]),
])
```
What happens in this code:
* We create an Evidently Report to compute aggregate Metrics.
* We use `TextEvals` to summarize all descriptors.
* We also add Tests for specific values we want to validate. You add Tests by picking a metric you want to assess, and adding a condition to it. (See [available Metrics](/metrics/all_metrics)).
* To set test conditions, you define the expectations using parameters like `gt` (greater than), `lt` (less than), `eq` (equal), etc. (Check [Test docs](/docs/library/tests)).
* We also label one of the tests (style match) as non-critical. This means it will trigger warning instead of a fail, and will be visually labeled yellow in the Report and the monitoring panel.
If you want to test share instead of count, use `share_tests` instead of `tests`.
**Run the Report**. Now that our Report with its test conditions is ready - let's run it! We will apply it to the `eval_dataset` that we prepared earlier, and send it to the Evidently Cloud.
```python theme={null}
my_eval = report.run(eval_dataset, None)
ws.add_run(project.id, my_eval, include_data=True)
```
Including data is optional but useful for most LLM use cases since you'd want to see not just the aggregate results but also the raw texts outputs.
You can preview the results in your Python notebook: call `my_eval` or `my_eval.json()`.
To view the results, navigate to the Evidently Platform. Go to the [Home Page](https://app.evidently.cloud/), enter your Project, and find the Reports section in the left menu. Here, you'll see the Report you can explore.
The Report will have two sections. Metrics show a summary or all values, and Tests will show the pass/fail results in the next tab. You will also see the Dataset with added scores and explanations.
Report view, with "Style" metric selected:
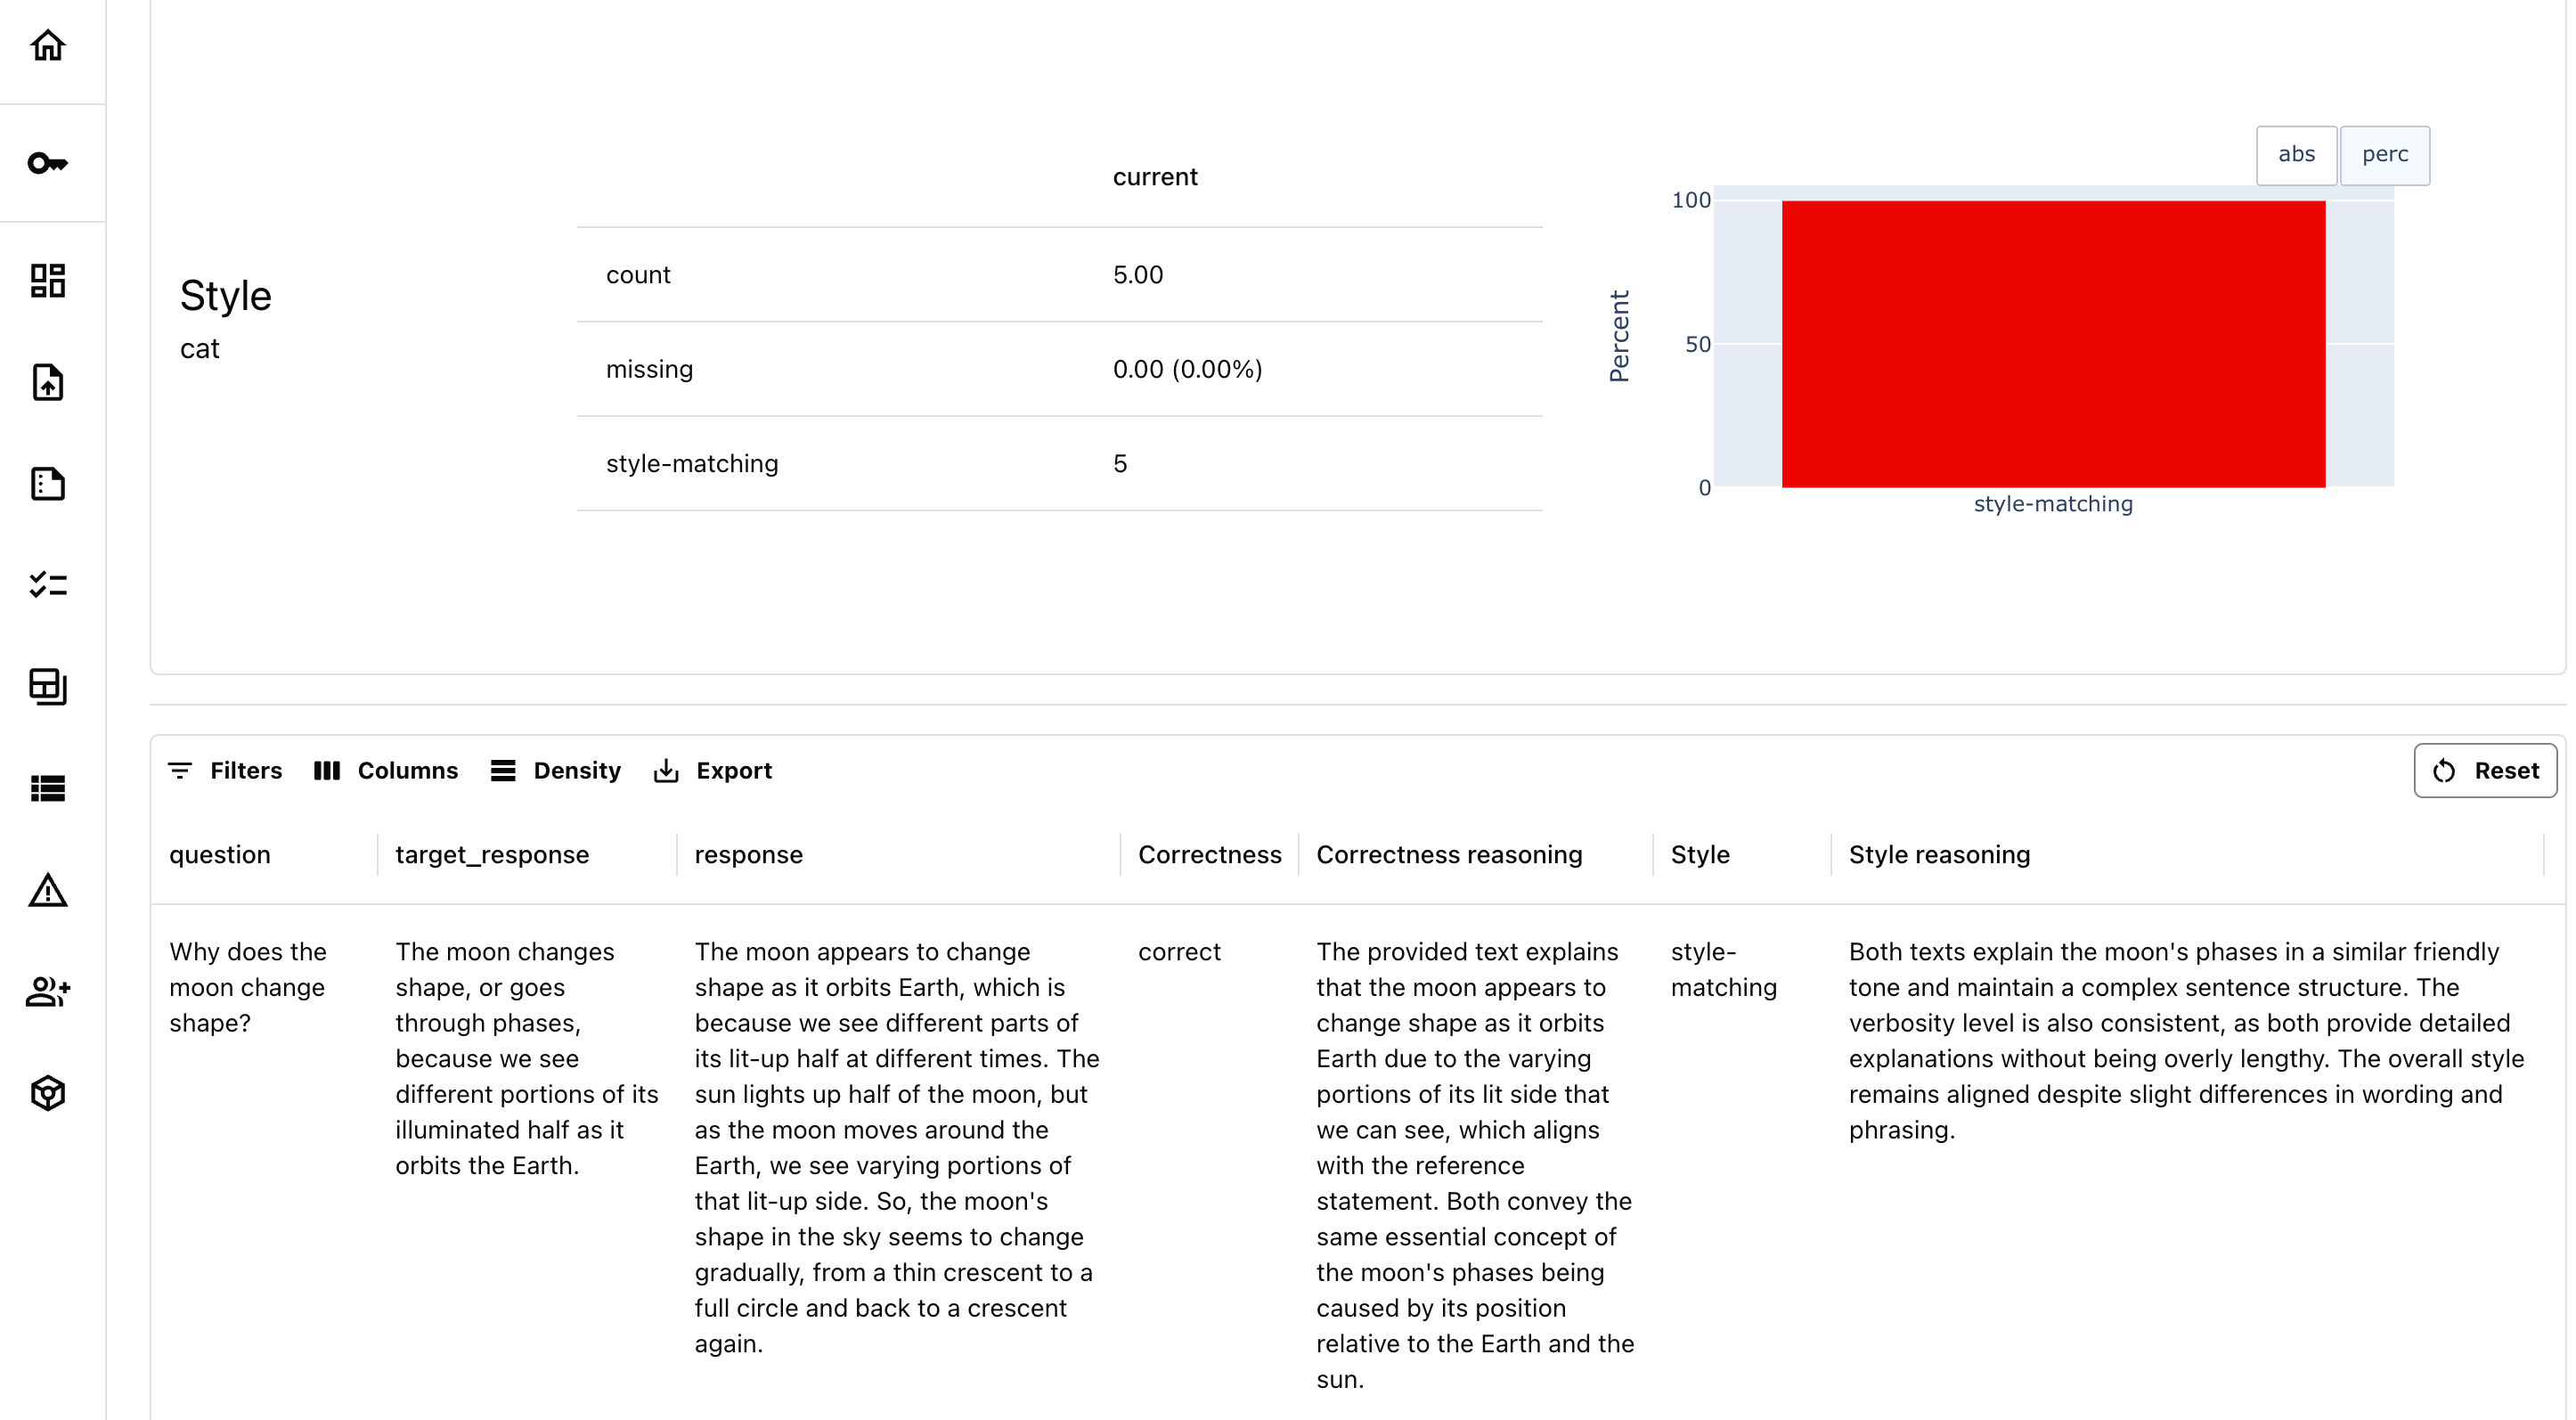 **Note**: your explanations will vary since LLMs are non-deterministic.
The Test Suite with all Test results:
**Note**: your explanations will vary since LLMs are non-deterministic.
The Test Suite with all Test results:
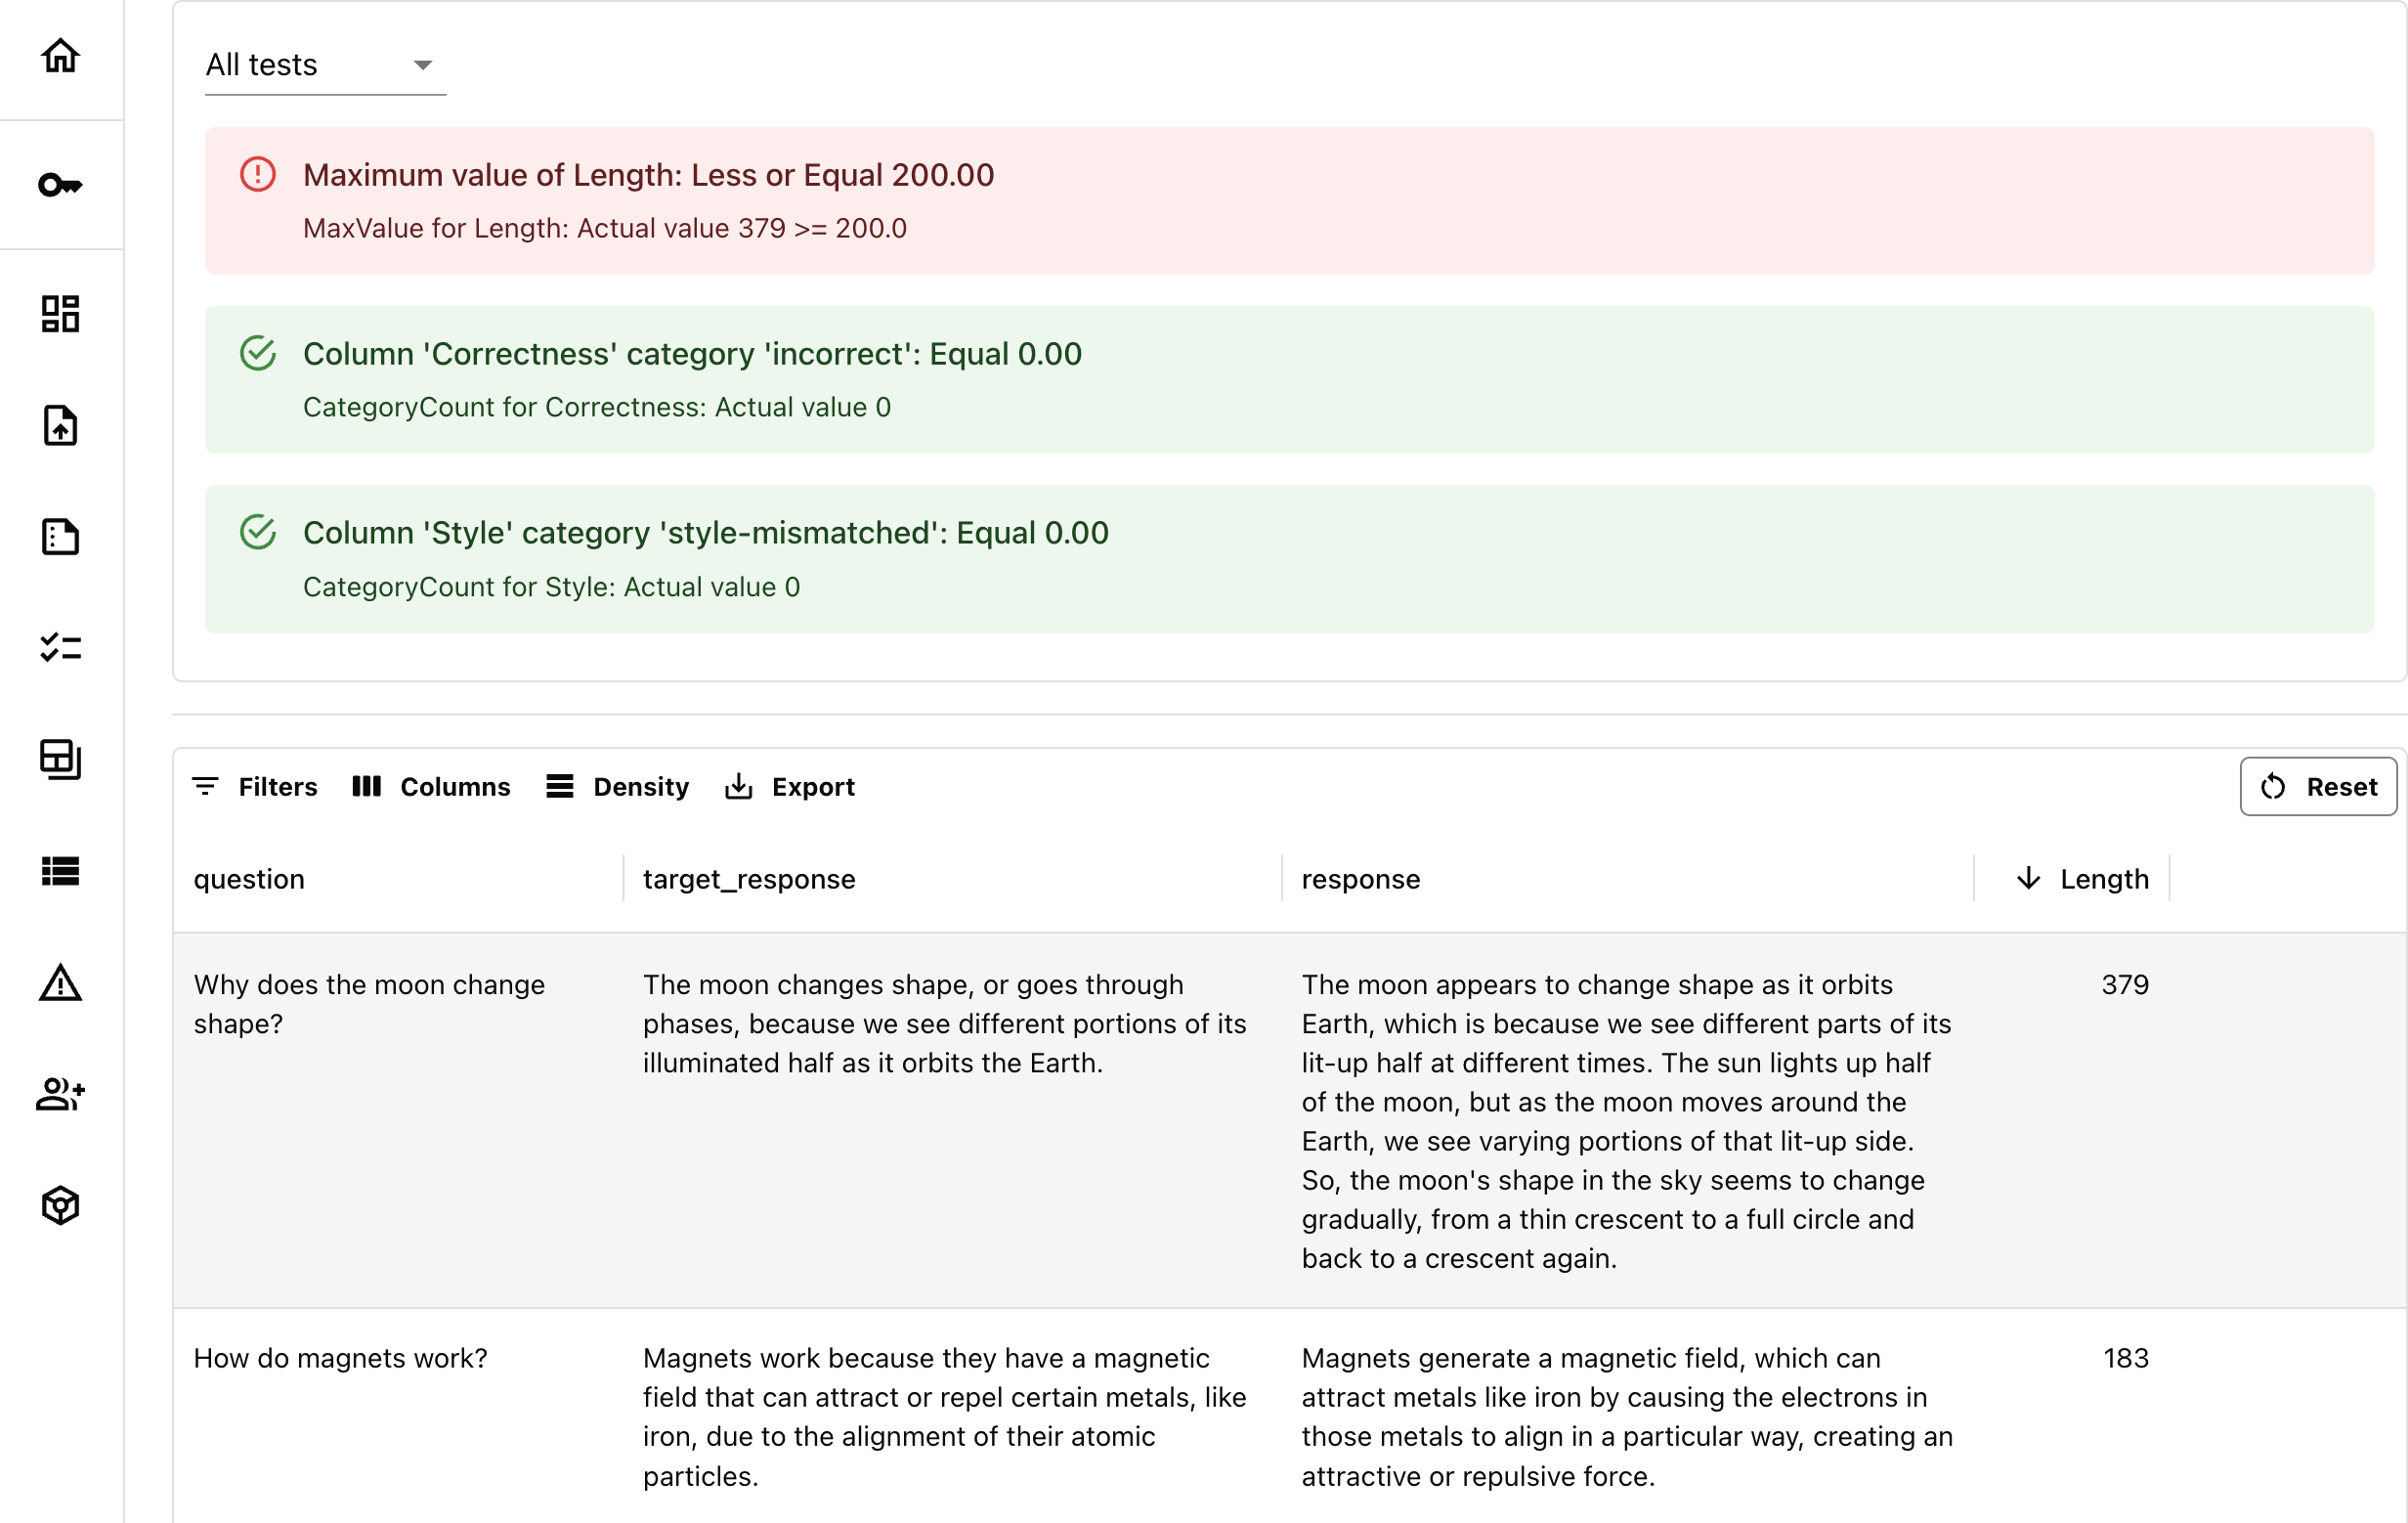 You can see that we failed the Length check. To find the failed output, you can sort the column "Length" in order and find the longest response.
**Using Tags**. You can optionally attach Tags to your Reports to associate this specific run with some parameter, like a prompt version. Check the [docs on Tags and Metadata](/docs/library/tags_metadata).
## 7. Test again
Let's say you made yet another change to the prompt. Our reference dataset stays the same, but we generate a new set of answers that we want to compare to this reference.
Here is the toy `eval_data_2` to imitate the result of the change.
```python theme={null}
data = [
["Why is the sky blue?",
"The sky is blue because molecules in the air scatter blue light from the sun more than they scatter red light.",
"The sky looks blue because air molecules scatter the blue light from the sun more effectively than other colors."],
["How do airplanes stay in the air?",
"Airplanes stay in the air because their wings create lift by forcing air to move faster over the top of the wing than underneath, which creates lower pressure on top.",
"Airplanes fly by generating lift through the wings, which makes the air move faster above them, lowering the pressure."],
["Why do we have seasons?",
"We have seasons because the Earth is tilted on its axis, which causes different parts of the Earth to receive more or less sunlight throughout the year.",
"Seasons change because the distance between the Earth and the sun varies throughout the year."], # This response contradicts the reference.
["How do magnets work?",
"Magnets work because they have a magnetic field that can attract or repel certain metals, like iron, due to the alignment of their atomic particles.",
"Magnets operate by creating a magnetic field, which interacts with certain metals like iron due to the specific alignment of atomic particles."],
["Why does the moon change shape?",
"The moon changes shape, or goes through phases, because we see different portions of its illuminated half as it orbits the Earth.",
"The moon's phases occur because we observe varying portions of its lit half as it moves around the Earth."]
]
columns = ["question", "target_response", "response"]
eval_data_2 = pd.DataFrame(data, columns=columns)
```
Create a new dataset:
```python theme={null}
eval_dataset_2 = Dataset.from_pandas(pd.DataFrame(eval_data_2),
data_definition=DataDefinition())
```
**Repeat the same evaluation as before.** Since we already defined the descriptors and Report composition with conditional checks, we only need to apply it to the new data:
```python theme={null}
eval_dataset_2.add_descriptors(descriptors=descriptors)
my_eval_2 = report.run(eval_dataset_2, None)
ws.add_run(project.id, my_eval_2, include_data=True)
```
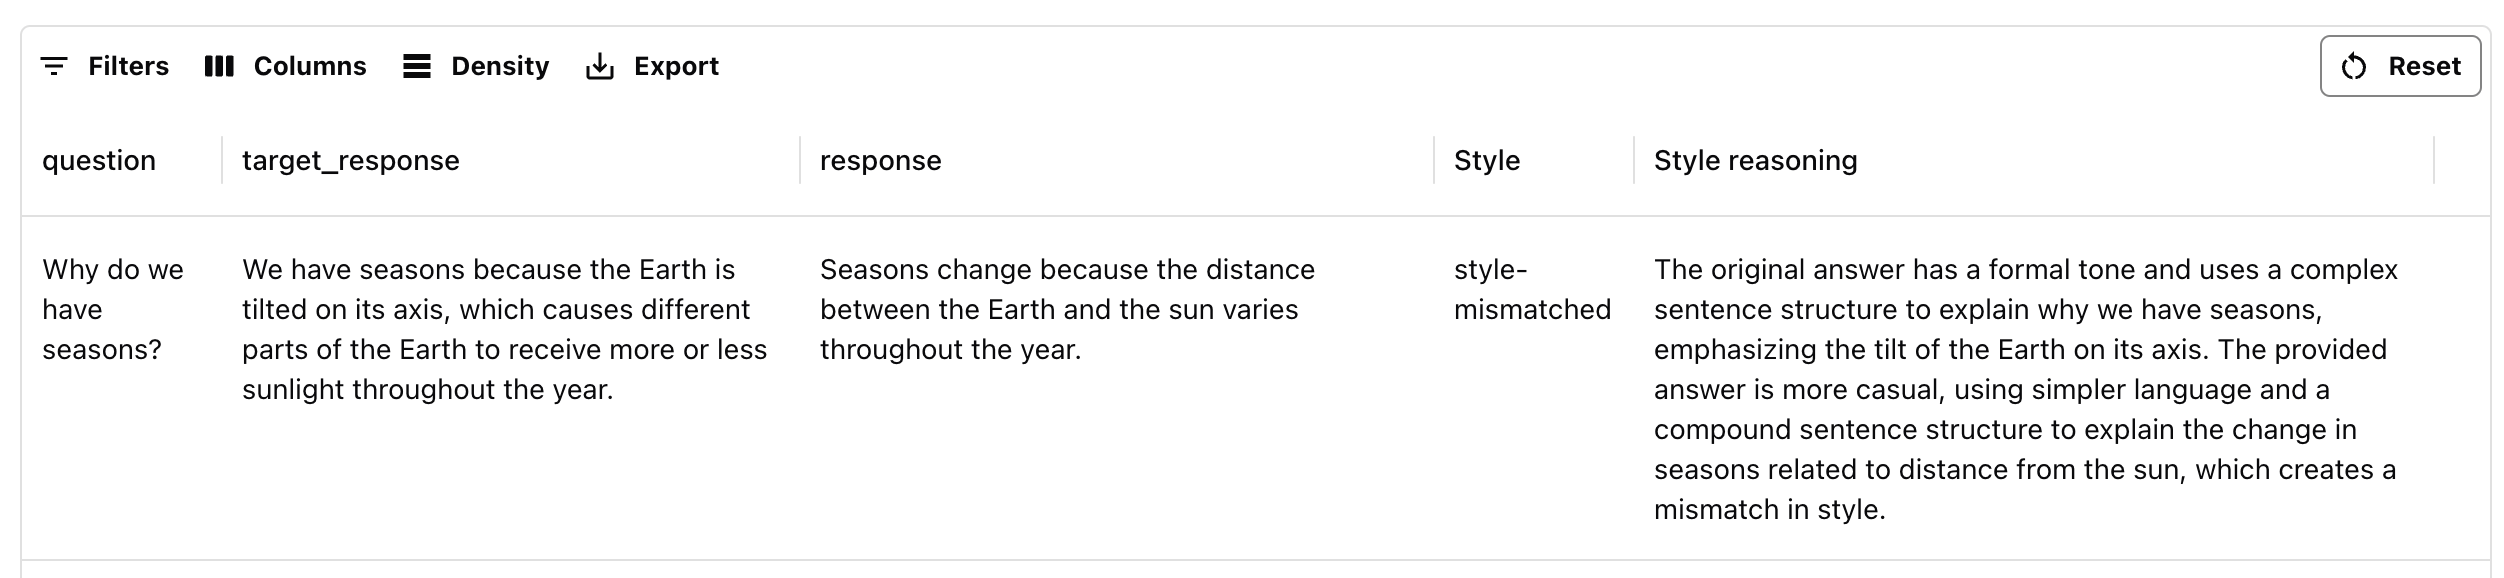
**Explore the new Report.** This time, the response length is within bounds, but one of the responses is incorrect: you can see the explanation of the contradition picked up by the LLM judge.
You can see that we failed the Length check. To find the failed output, you can sort the column "Length" in order and find the longest response.
**Using Tags**. You can optionally attach Tags to your Reports to associate this specific run with some parameter, like a prompt version. Check the [docs on Tags and Metadata](/docs/library/tags_metadata).
## 7. Test again
Let's say you made yet another change to the prompt. Our reference dataset stays the same, but we generate a new set of answers that we want to compare to this reference.
Here is the toy `eval_data_2` to imitate the result of the change.
```python theme={null}
data = [
["Why is the sky blue?",
"The sky is blue because molecules in the air scatter blue light from the sun more than they scatter red light.",
"The sky looks blue because air molecules scatter the blue light from the sun more effectively than other colors."],
["How do airplanes stay in the air?",
"Airplanes stay in the air because their wings create lift by forcing air to move faster over the top of the wing than underneath, which creates lower pressure on top.",
"Airplanes fly by generating lift through the wings, which makes the air move faster above them, lowering the pressure."],
["Why do we have seasons?",
"We have seasons because the Earth is tilted on its axis, which causes different parts of the Earth to receive more or less sunlight throughout the year.",
"Seasons change because the distance between the Earth and the sun varies throughout the year."], # This response contradicts the reference.
["How do magnets work?",
"Magnets work because they have a magnetic field that can attract or repel certain metals, like iron, due to the alignment of their atomic particles.",
"Magnets operate by creating a magnetic field, which interacts with certain metals like iron due to the specific alignment of atomic particles."],
["Why does the moon change shape?",
"The moon changes shape, or goes through phases, because we see different portions of its illuminated half as it orbits the Earth.",
"The moon's phases occur because we observe varying portions of its lit half as it moves around the Earth."]
]
columns = ["question", "target_response", "response"]
eval_data_2 = pd.DataFrame(data, columns=columns)
```
Create a new dataset:
```python theme={null}
eval_dataset_2 = Dataset.from_pandas(pd.DataFrame(eval_data_2),
data_definition=DataDefinition())
```
**Repeat the same evaluation as before.** Since we already defined the descriptors and Report composition with conditional checks, we only need to apply it to the new data:
```python theme={null}
eval_dataset_2.add_descriptors(descriptors=descriptors)
my_eval_2 = report.run(eval_dataset_2, None)
ws.add_run(project.id, my_eval_2, include_data=True)
```
**Explore the new Report.** This time, the response length is within bounds, but one of the responses is incorrect: you can see the explanation of the contradition picked up by the LLM judge.
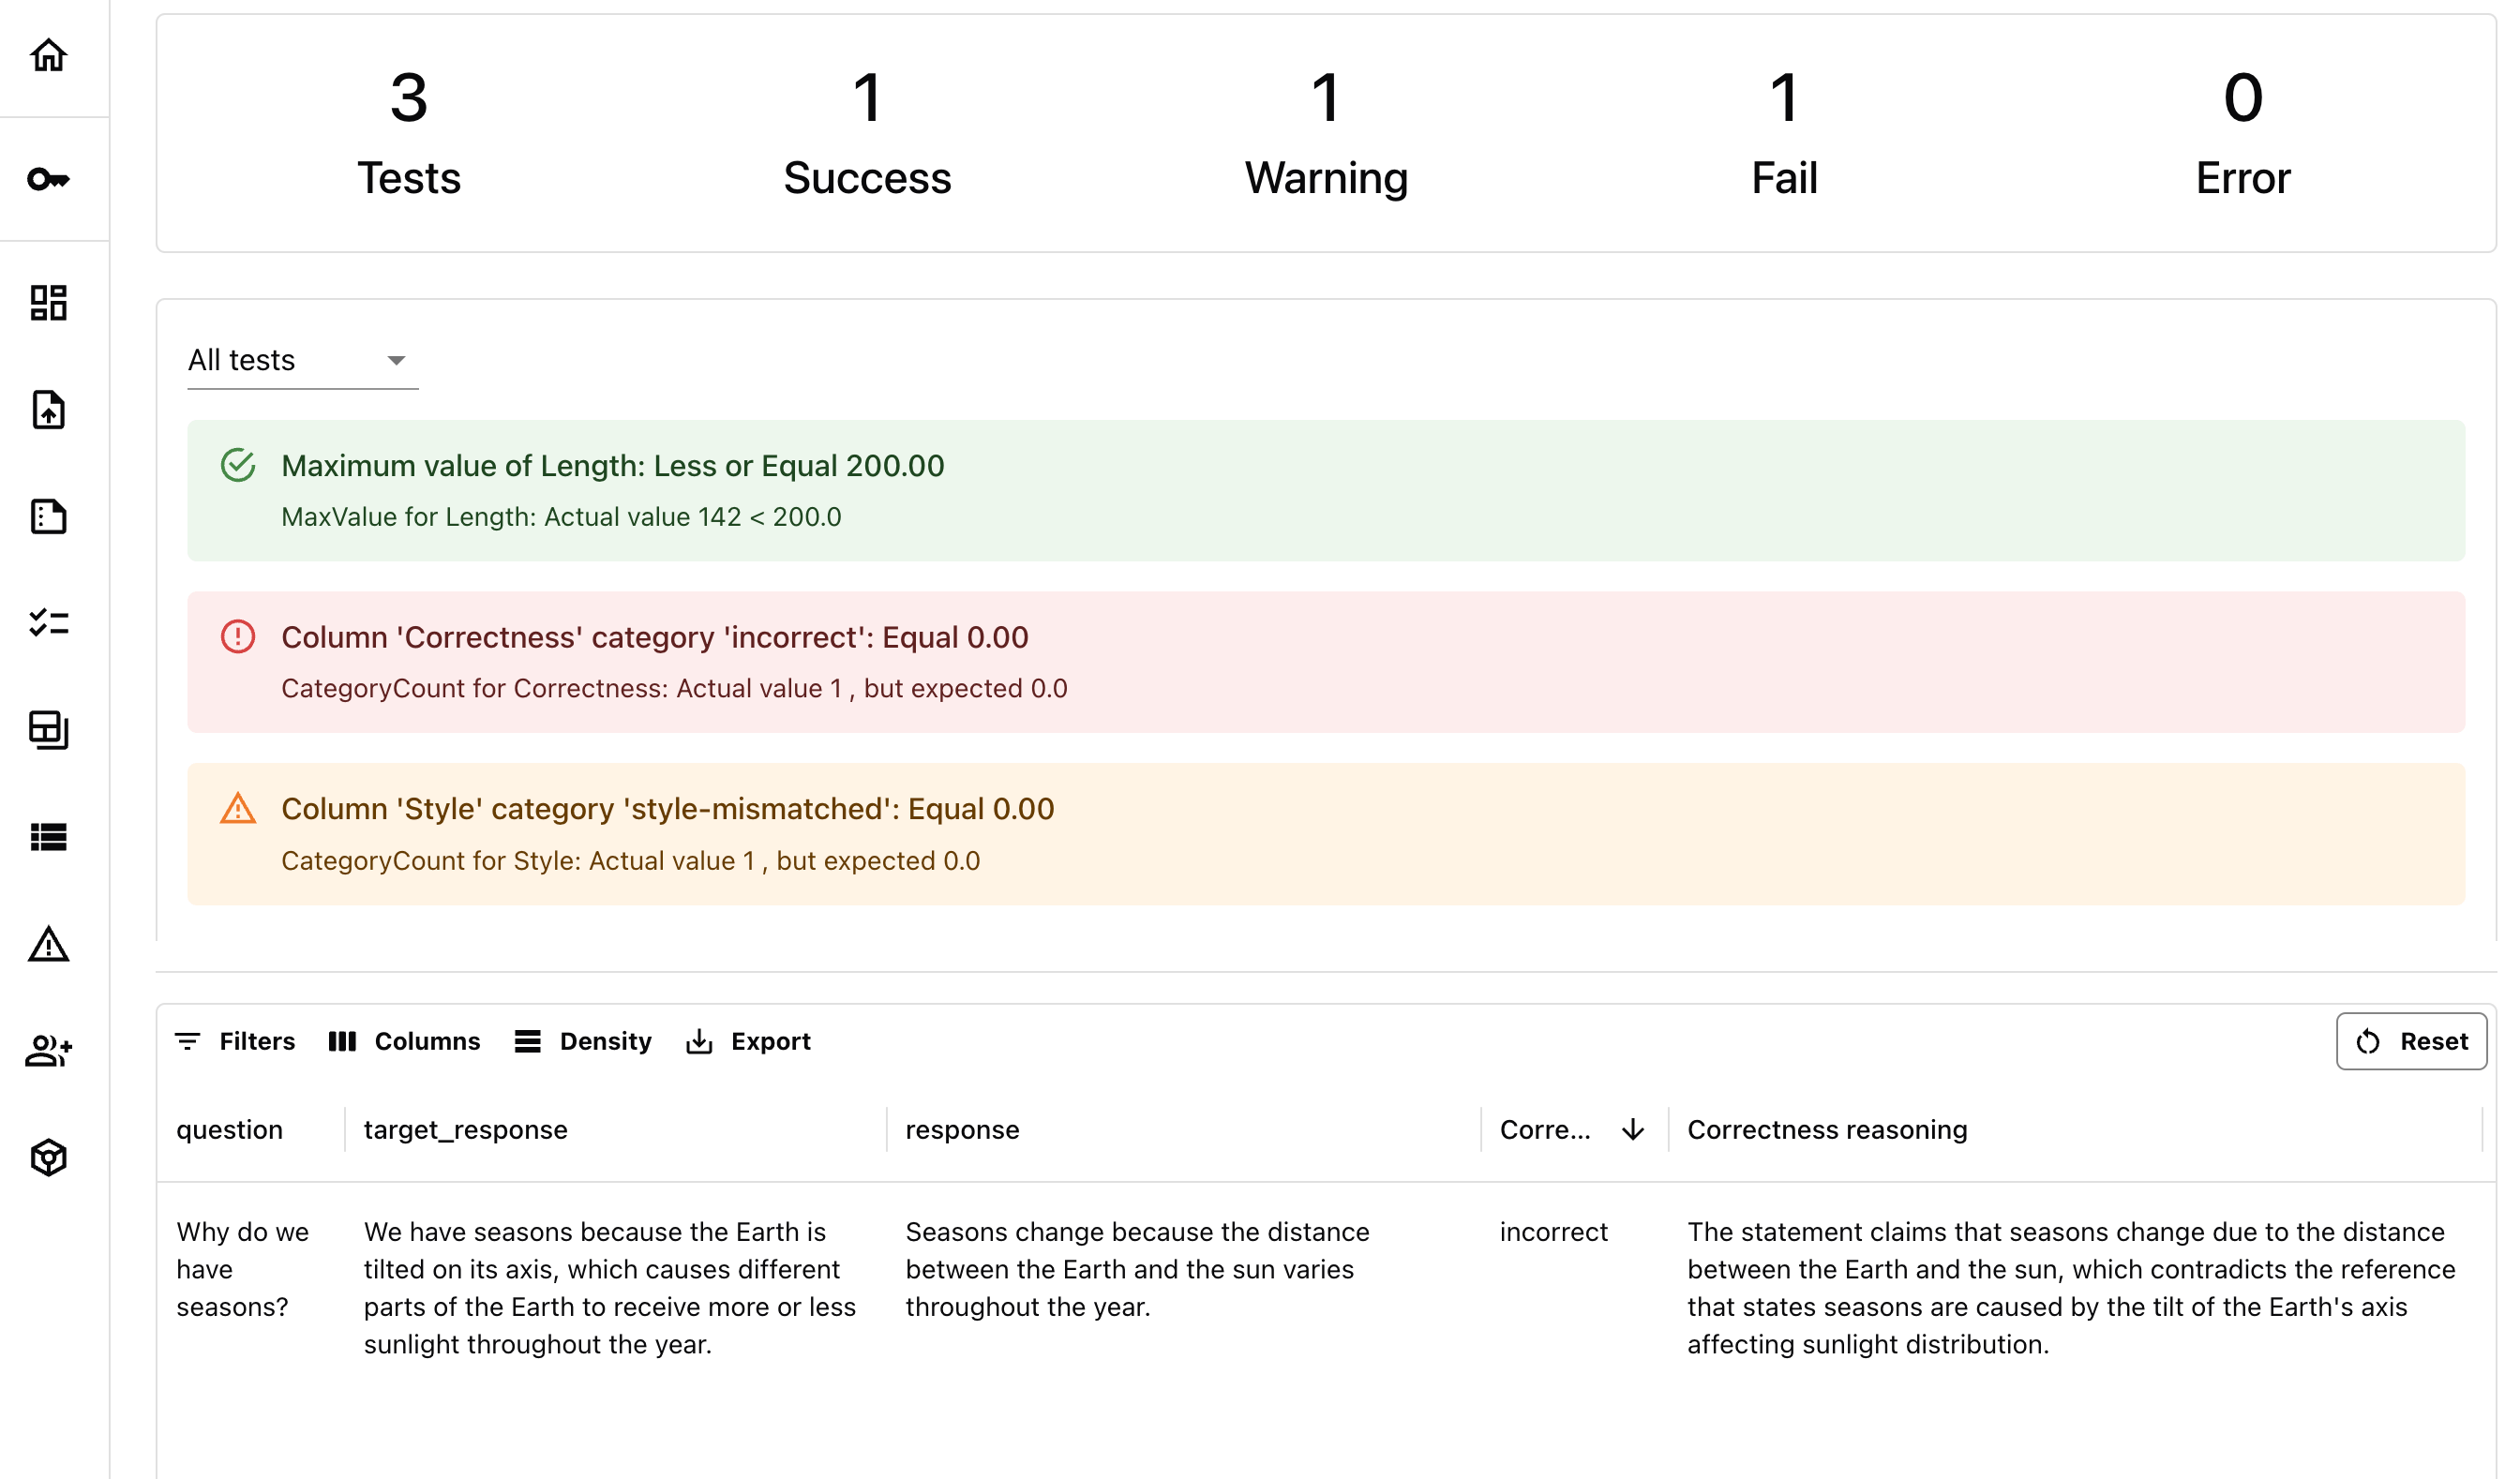 There is also a "softer" fail for one of the responses that now has a different tone.
 ## 8. Get a Dashboard
As you run multiple Reports, you may want to track results in time to see if you are improving. You can configure a Dashboard, both in UI or programmatically.
Let's create a couple of Panels using Dashboards as code approach so that it's easy to reproduce. The following code will add:
* A counter panel to show the SUCCESS rate of the latest Test run.
* A test monitoring panel to show all Test results over time.
```python theme={null}
project.dashboard.add_panel(
DashboardPanelTestSuiteCounter(
title="Latest Test run",
filter=ReportFilter(metadata_values={}, tag_values=[]),
size=WidgetSize.FULL,
statuses=[TestStatus.SUCCESS],
agg=CounterAgg.LAST,
),
tab="Tests"
)
project.dashboard.add_panel(
DashboardPanelTestSuite(
title="Test results",
filter=ReportFilter(metadata_values={}, tag_values=[]),
size=WidgetSize.FULL,
panel_type=TestSuitePanelType.DETAILED,
),
tab="Tests"
)
project.save()
```
When you navigate to the UI, you will now see a Panel which shows a summary of Test results (Success, Failure, and Warning) for each Report we ran. As you add more Tests to the same Project, the Panels will be automatically updated to show new Test results.
## 8. Get a Dashboard
As you run multiple Reports, you may want to track results in time to see if you are improving. You can configure a Dashboard, both in UI or programmatically.
Let's create a couple of Panels using Dashboards as code approach so that it's easy to reproduce. The following code will add:
* A counter panel to show the SUCCESS rate of the latest Test run.
* A test monitoring panel to show all Test results over time.
```python theme={null}
project.dashboard.add_panel(
DashboardPanelTestSuiteCounter(
title="Latest Test run",
filter=ReportFilter(metadata_values={}, tag_values=[]),
size=WidgetSize.FULL,
statuses=[TestStatus.SUCCESS],
agg=CounterAgg.LAST,
),
tab="Tests"
)
project.dashboard.add_panel(
DashboardPanelTestSuite(
title="Test results",
filter=ReportFilter(metadata_values={}, tag_values=[]),
size=WidgetSize.FULL,
panel_type=TestSuitePanelType.DETAILED,
),
tab="Tests"
)
project.save()
```
When you navigate to the UI, you will now see a Panel which shows a summary of Test results (Success, Failure, and Warning) for each Report we ran. As you add more Tests to the same Project, the Panels will be automatically updated to show new Test results.
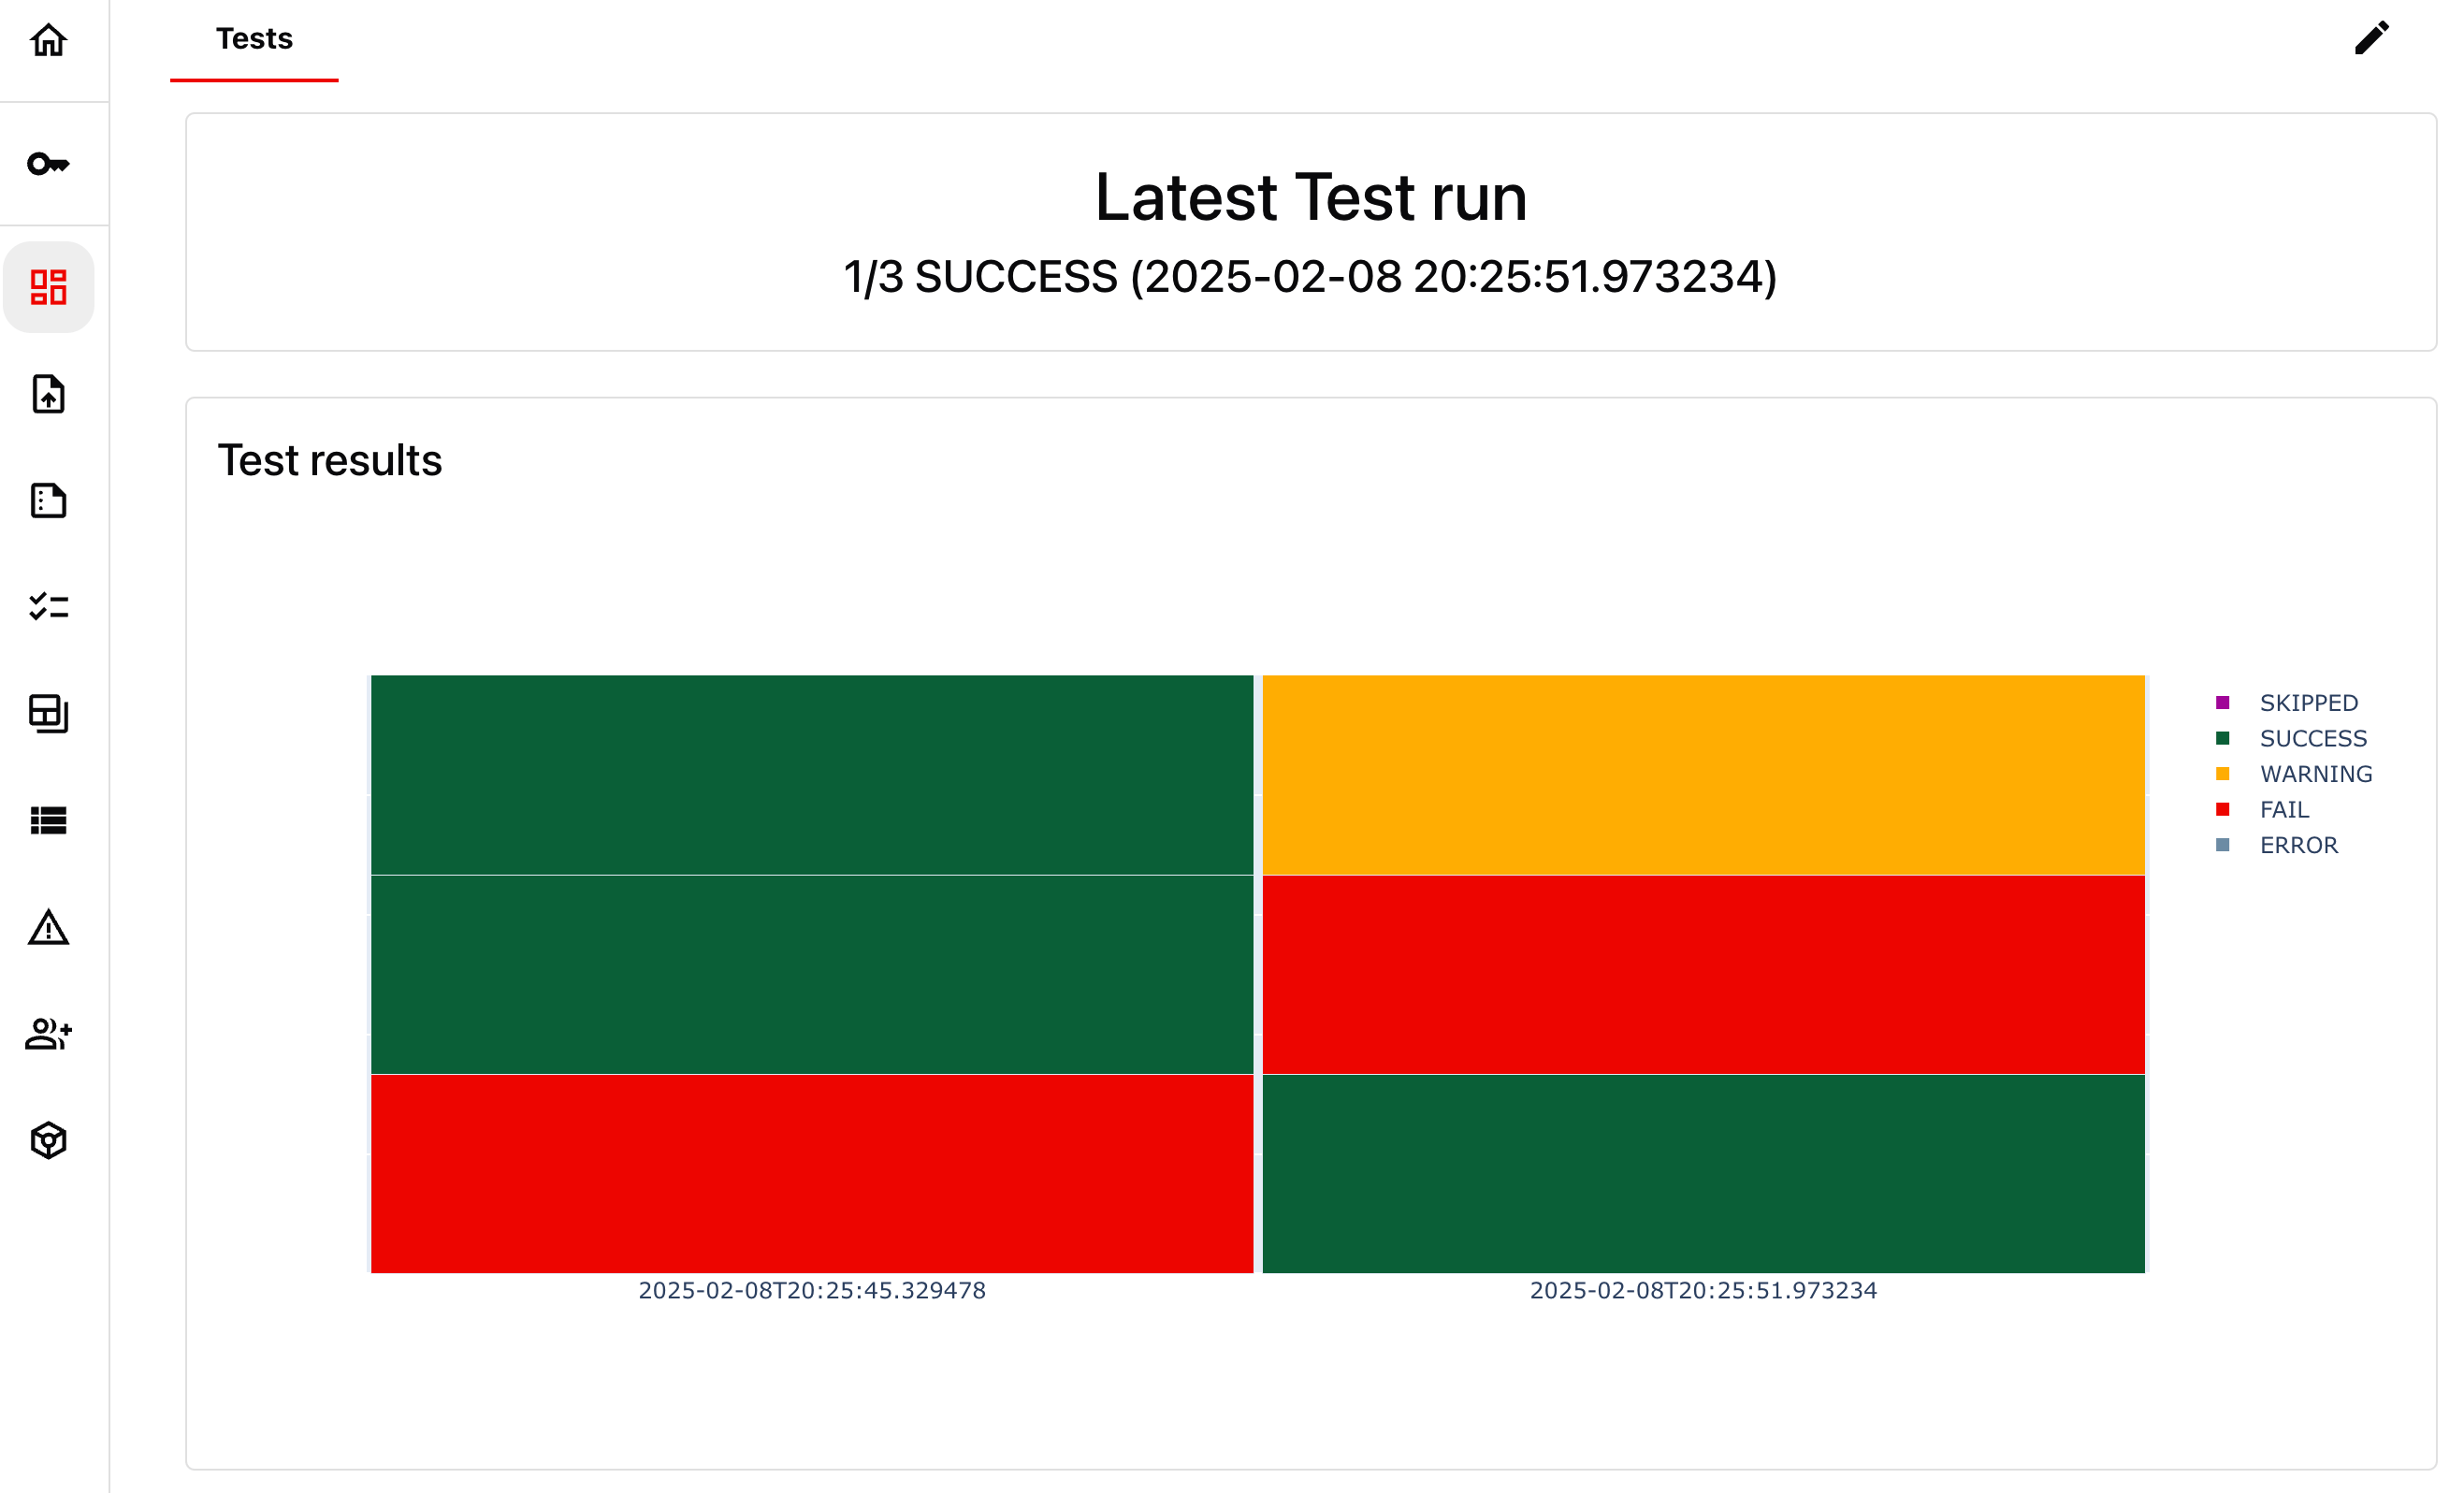 If you hover over individual Test results, you will able to see the specific Test and conditions. You can click on it to open up the specific underlying Report to explore.
**Using Dashboards**. You can design and add other Panel types, like simply plotting mean/max values or distributions of scores over time. Check the [docs on Dashboards](/docs/platform/dashboard).
**What's next?** As you design a similar Test Suite for your use case, you can integrate it with CI/CD workflows to run on every change. You can also enable alerts to be sent to your email / Slack whenever the Tests fail.
If you hover over individual Test results, you will able to see the specific Test and conditions. You can click on it to open up the specific underlying Report to explore.
**Using Dashboards**. You can design and add other Panel types, like simply plotting mean/max values or distributions of scores over time. Check the [docs on Dashboards](/docs/platform/dashboard).
**What's next?** As you design a similar Test Suite for your use case, you can integrate it with CI/CD workflows to run on every change. You can also enable alerts to be sent to your email / Slack whenever the Tests fail.