> ## Documentation Index
> Fetch the complete documentation index at: https://docs.evidentlyai.com/llms.txt
> Use this file to discover all available pages before exploring further.
# Batch monitoring
> How to run batch evaluation jobs.
Read the overview of the approach [here](/docs/platform/monitoring_overview).
 Batch monitoring relies on the core evaluation API of the Evidently Python library. Check the [detailed guide](/docs/library/evaluations_overview).
## Simple Example
You must first connect to [Evidently Cloud](/docs/setup/cloud) or local workspace and [create a Project](/docs/platform/projects_manage).
To get the dataset stats for a single batch and upload to the workspace:
```python theme={null}
eval_data = Dataset.from_pandas(
pd.DataFrame(source_df),
data_definition=DataDefinition()
)
report = Report([
DatasetStats()
])
my_eval = report.run(eval_data, None)
ws.add_run(project.id, my_eval, include_data=False)
```
## Workflow
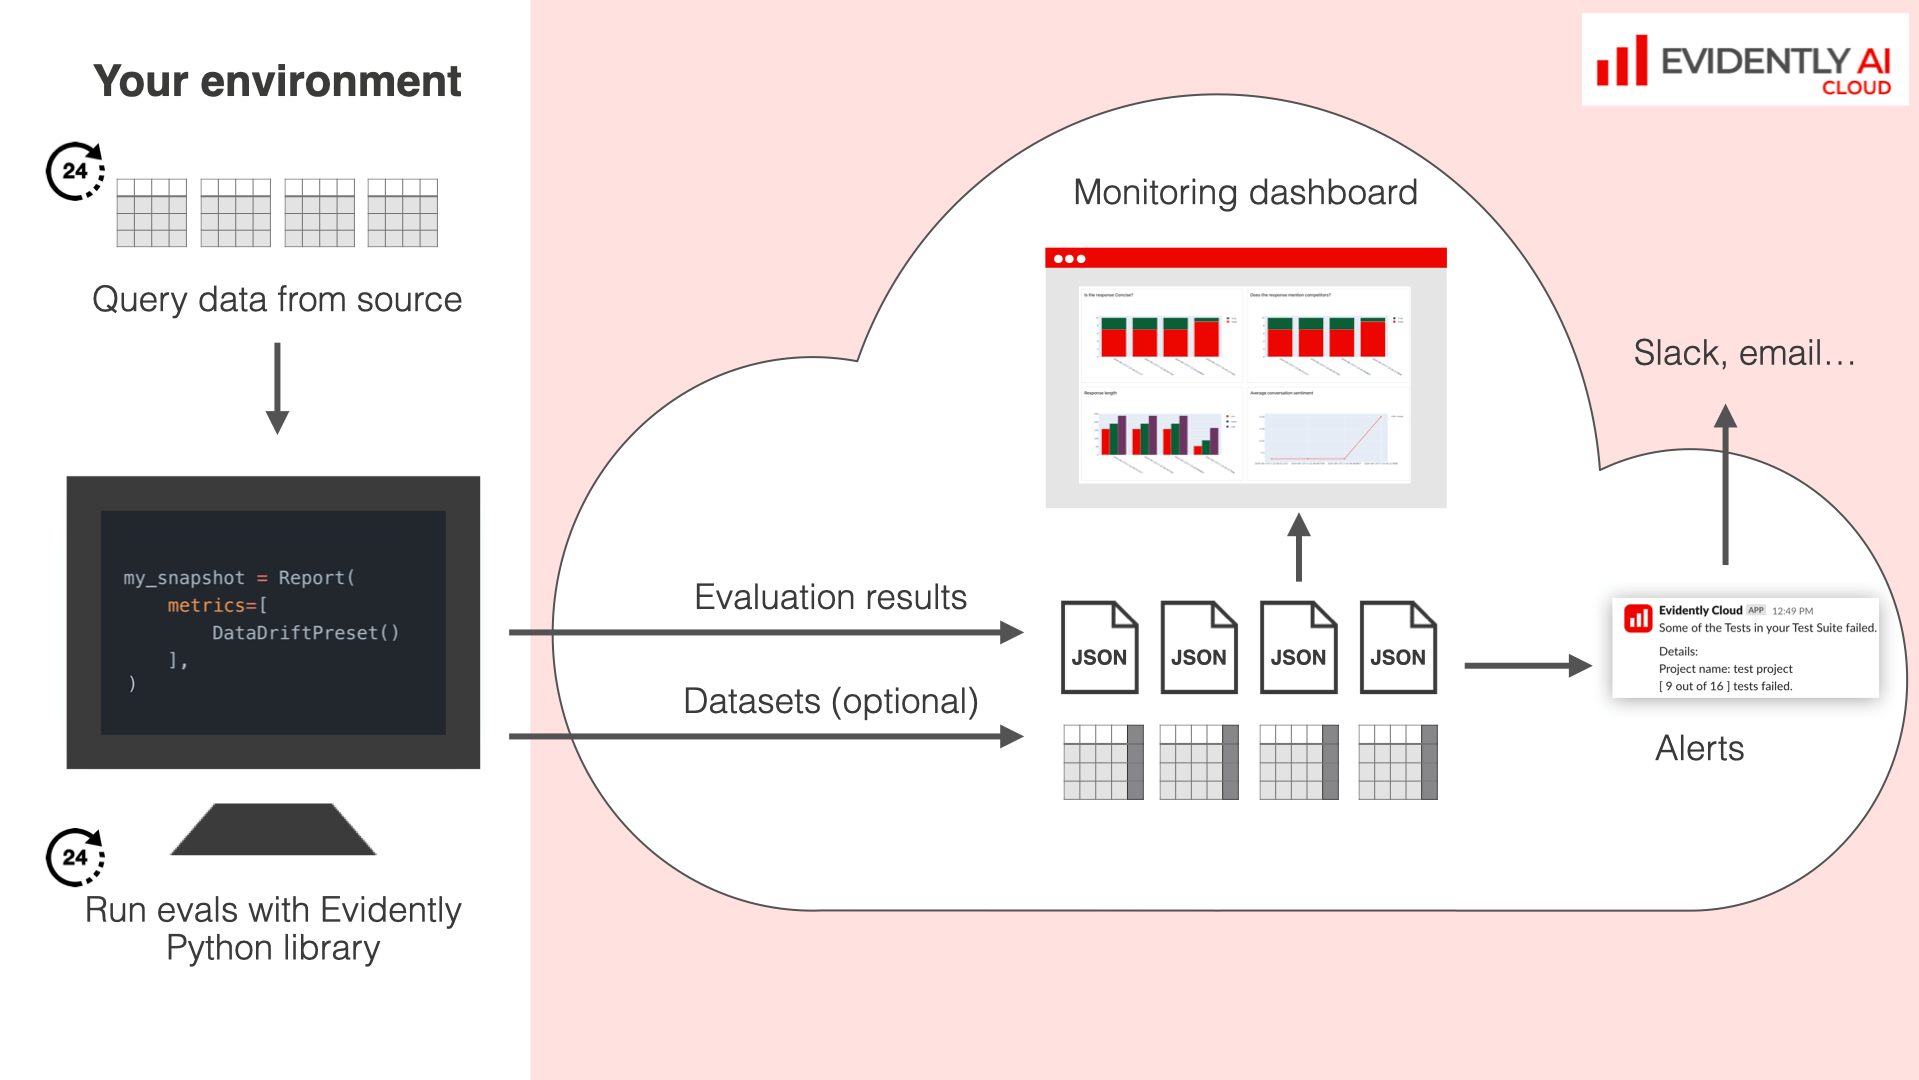
The complete workflow looks as the following.
Define an [Evidently Report](/docs/library/report) with optional [Test](/docs/library/tests) conditions to define the evals.
You must independently execute Reports on a chosen cadence. Consider tools like Airflow. You can send Reports from different steps in your pipeline. For example:
* first, send data quality, data drift and prediction drift checks
* after you get the delayed labels, send a ML quality checks results.
You can backdate your Reports with a custom timestamp.
Batch monitoring relies on the core evaluation API of the Evidently Python library. Check the [detailed guide](/docs/library/evaluations_overview).
## Simple Example
You must first connect to [Evidently Cloud](/docs/setup/cloud) or local workspace and [create a Project](/docs/platform/projects_manage).
To get the dataset stats for a single batch and upload to the workspace:
```python theme={null}
eval_data = Dataset.from_pandas(
pd.DataFrame(source_df),
data_definition=DataDefinition()
)
report = Report([
DatasetStats()
])
my_eval = report.run(eval_data, None)
ws.add_run(project.id, my_eval, include_data=False)
```
## Workflow
The complete workflow looks as the following.
Define an [Evidently Report](/docs/library/report) with optional [Test](/docs/library/tests) conditions to define the evals.
You must independently execute Reports on a chosen cadence. Consider tools like Airflow. You can send Reports from different steps in your pipeline. For example:
* first, send data quality, data drift and prediction drift checks
* after you get the delayed labels, send a ML quality checks results.
You can backdate your Reports with a custom timestamp. 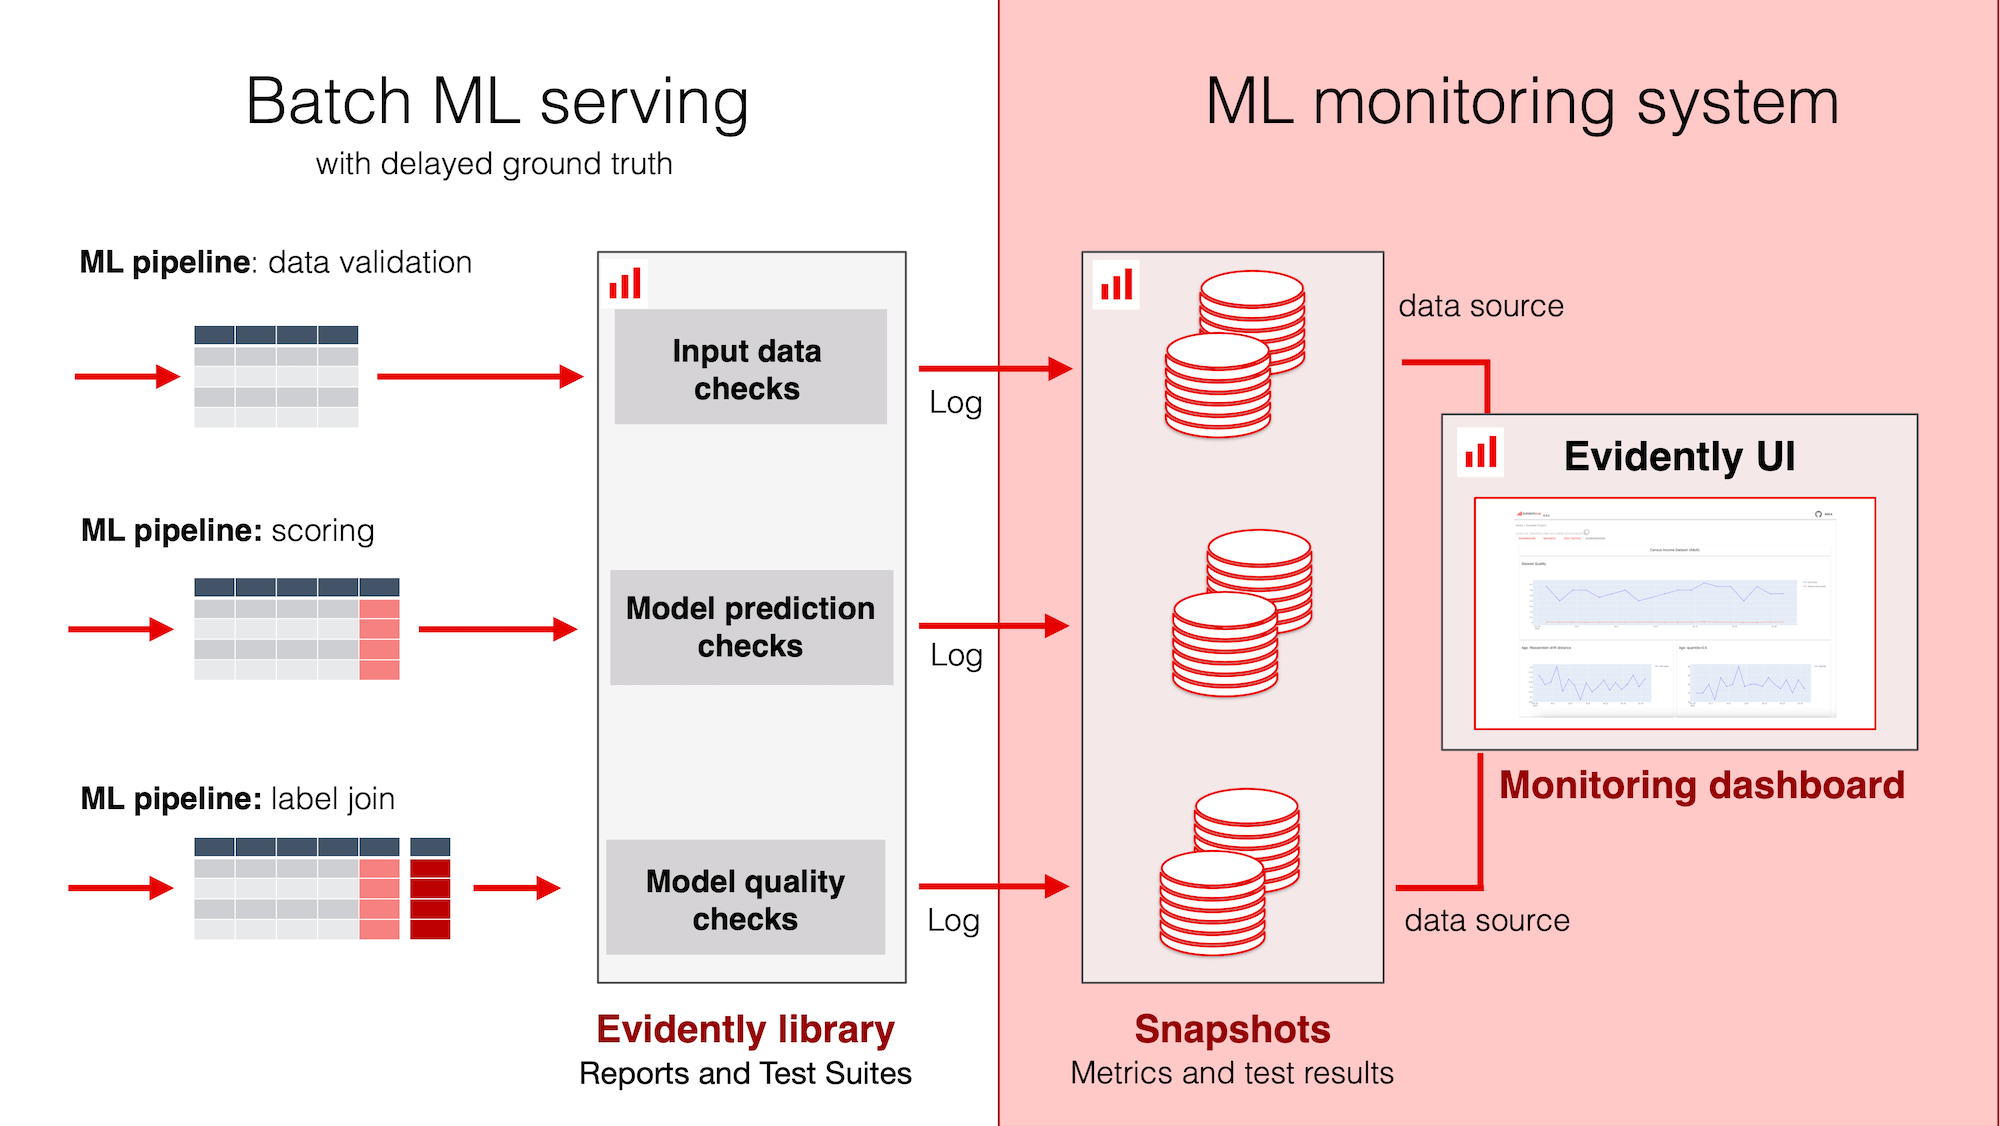 Choose to store raw inferences or only upload the metric summaries. [How to upload / delete results](/docs/platform/evals_api).
Set up a Dashboard to track results over time: using pre-built Tabs or configure your own choice of monitoring Panels. Check the [Dashboard guide](/docs/platform/dashboard_overview).
Set up alerts on Metric values or Test failures. Check the section on [Alerts](/docs/platform/alerts).
**Running Tests vs Reports**. Structuring your evaluations as Tests - as opposed to monitoring lots of metrics at once - can help reduce alert fatigue and simplify configuration when evaluating multiple conditions at once. For example, you can quickly verify that all columns in the input data are within a defined min-max range.
Choose to store raw inferences or only upload the metric summaries. [How to upload / delete results](/docs/platform/evals_api).
Set up a Dashboard to track results over time: using pre-built Tabs or configure your own choice of monitoring Panels. Check the [Dashboard guide](/docs/platform/dashboard_overview).
Set up alerts on Metric values or Test failures. Check the section on [Alerts](/docs/platform/alerts).
**Running Tests vs Reports**. Structuring your evaluations as Tests - as opposed to monitoring lots of metrics at once - can help reduce alert fatigue and simplify configuration when evaluating multiple conditions at once. For example, you can quickly verify that all columns in the input data are within a defined min-max range.