> ## Documentation Index
> Fetch the complete documentation index at: https://docs.evidentlyai.com/llms.txt
> Use this file to discover all available pages before exploring further.
# Descriptors
> How to run evaluations for text data.
To evaluate text data, like LLM inputs and outputs, you create **Descriptors**. This is a universal interface for all evals - from text statistics to LLM judges.
Each descriptor computes a score or label per row of your dataset. You can combine multiple descriptors and set optional pass/fail conditions. You can use built-in descriptors or create custom ones using LLM prompts or Python.
For a general introduction, check [Core Concepts](/docs/library/overview). You can also refer to the [LLM quickstart](quickstart_llm) for a minimal example.
## Basic flow
Use this code snippet to create sample data for testing:
```python theme={null}
import pandas as pd
data = [
["What is the chemical symbol for gold?", "The chemical symbol for gold is Au."],
["What is the capital of Japan?", "The capital of Japan is Tokyo."],
["Tell me a joke.", "Why don't programmers like nature? It has too many bugs!"],
["What is the boiling point of water?", "The boiling point of water is 100 degrees Celsius (212 degrees Fahrenheit)."],
["Who painted the Mona Lisa?", "Leonardo da Vinci painted the Mona Lisa."],
["What’s the fastest animal on land?", "The cheetah is the fastest land animal, capable of running up to 75 miles per hour."],
["Can you help me with my math homework?", "I'm sorry, but I can't assist with homework. You might want to consult your teacher for help."],
["How many states are there in the USA?", "There are 50 states in the USA."],
["What’s the primary function of the heart?", "The primary function of the heart is to pump blood throughout the body."],
["Can you tell me the latest stock market trends?", "I'm sorry, but I can't provide real-time stock market trends. You might want to check a financial news website or consult a financial advisor."]
]
# Columns
columns = ["question", "answer"]
# Creating the DataFrame
df = pd.DataFrame(data, columns=columns)
```
**Step 1. Imports.** Import the following modules:
```python theme={null}
from evidently import Dataset
from evidently import DataDefinition
from evidently import Report
from evidently.descriptors import *
from evidently.presets import TextEvals
```
**Note**. Some Descriptors (like `OOVWordsPercentage()` may require `nltk` dictionaries:
```python theme={null}
nltk.download('words')
nltk.download('wordnet')
nltk.download('omw-1.4')
nltk.download('vader_lexicon')
```
**Step 2. Add descriptors** via the Dataset object. There are two ways to do this:
* **Option A.** Simultaneously create the `Dataset` object and add descriptors to the selected columns (in this case, "answer" column).
```python theme={null}
eval_dataset = Dataset.from_pandas(
df,
data_definition=DataDefinition(
text_columns=["question", "answer"]),
descriptors=[
Sentiment("answer", alias="Sentiment"),
TextLength("answer", alias="Length"),
IncludesWords("answer", words_list=['sorry', 'apologize'], alias="Denials"),
]
)
```
Read more on how how to [create the Dataset and Data Definition](/docs/library/data_definition)
* **Option B.** Add descriptors to the existing Dataset using `add_descriptors`.
For example, first create the Dataset.
```python theme={null}
eval_dataset = Dataset.from_pandas(
df,
data_definition=DataDefinition(text_columns=["question", "answer"]),
)
```
Then, add the scores to this Dataset:
```python theme={null}
eval_dataset.add_descriptors(descriptors=[
Sentiment("answer", alias="Sentiment"),
TextLength("answer", alias="Length"),
IncludesWords("answer", words_list=['sorry', 'apologize'], alias="Denials"),
])
```
**Step 3. (Optional). Export results**. You can preview the DataFrame with results:
```python theme={null}
eval_dataset.as_dataframe()
```
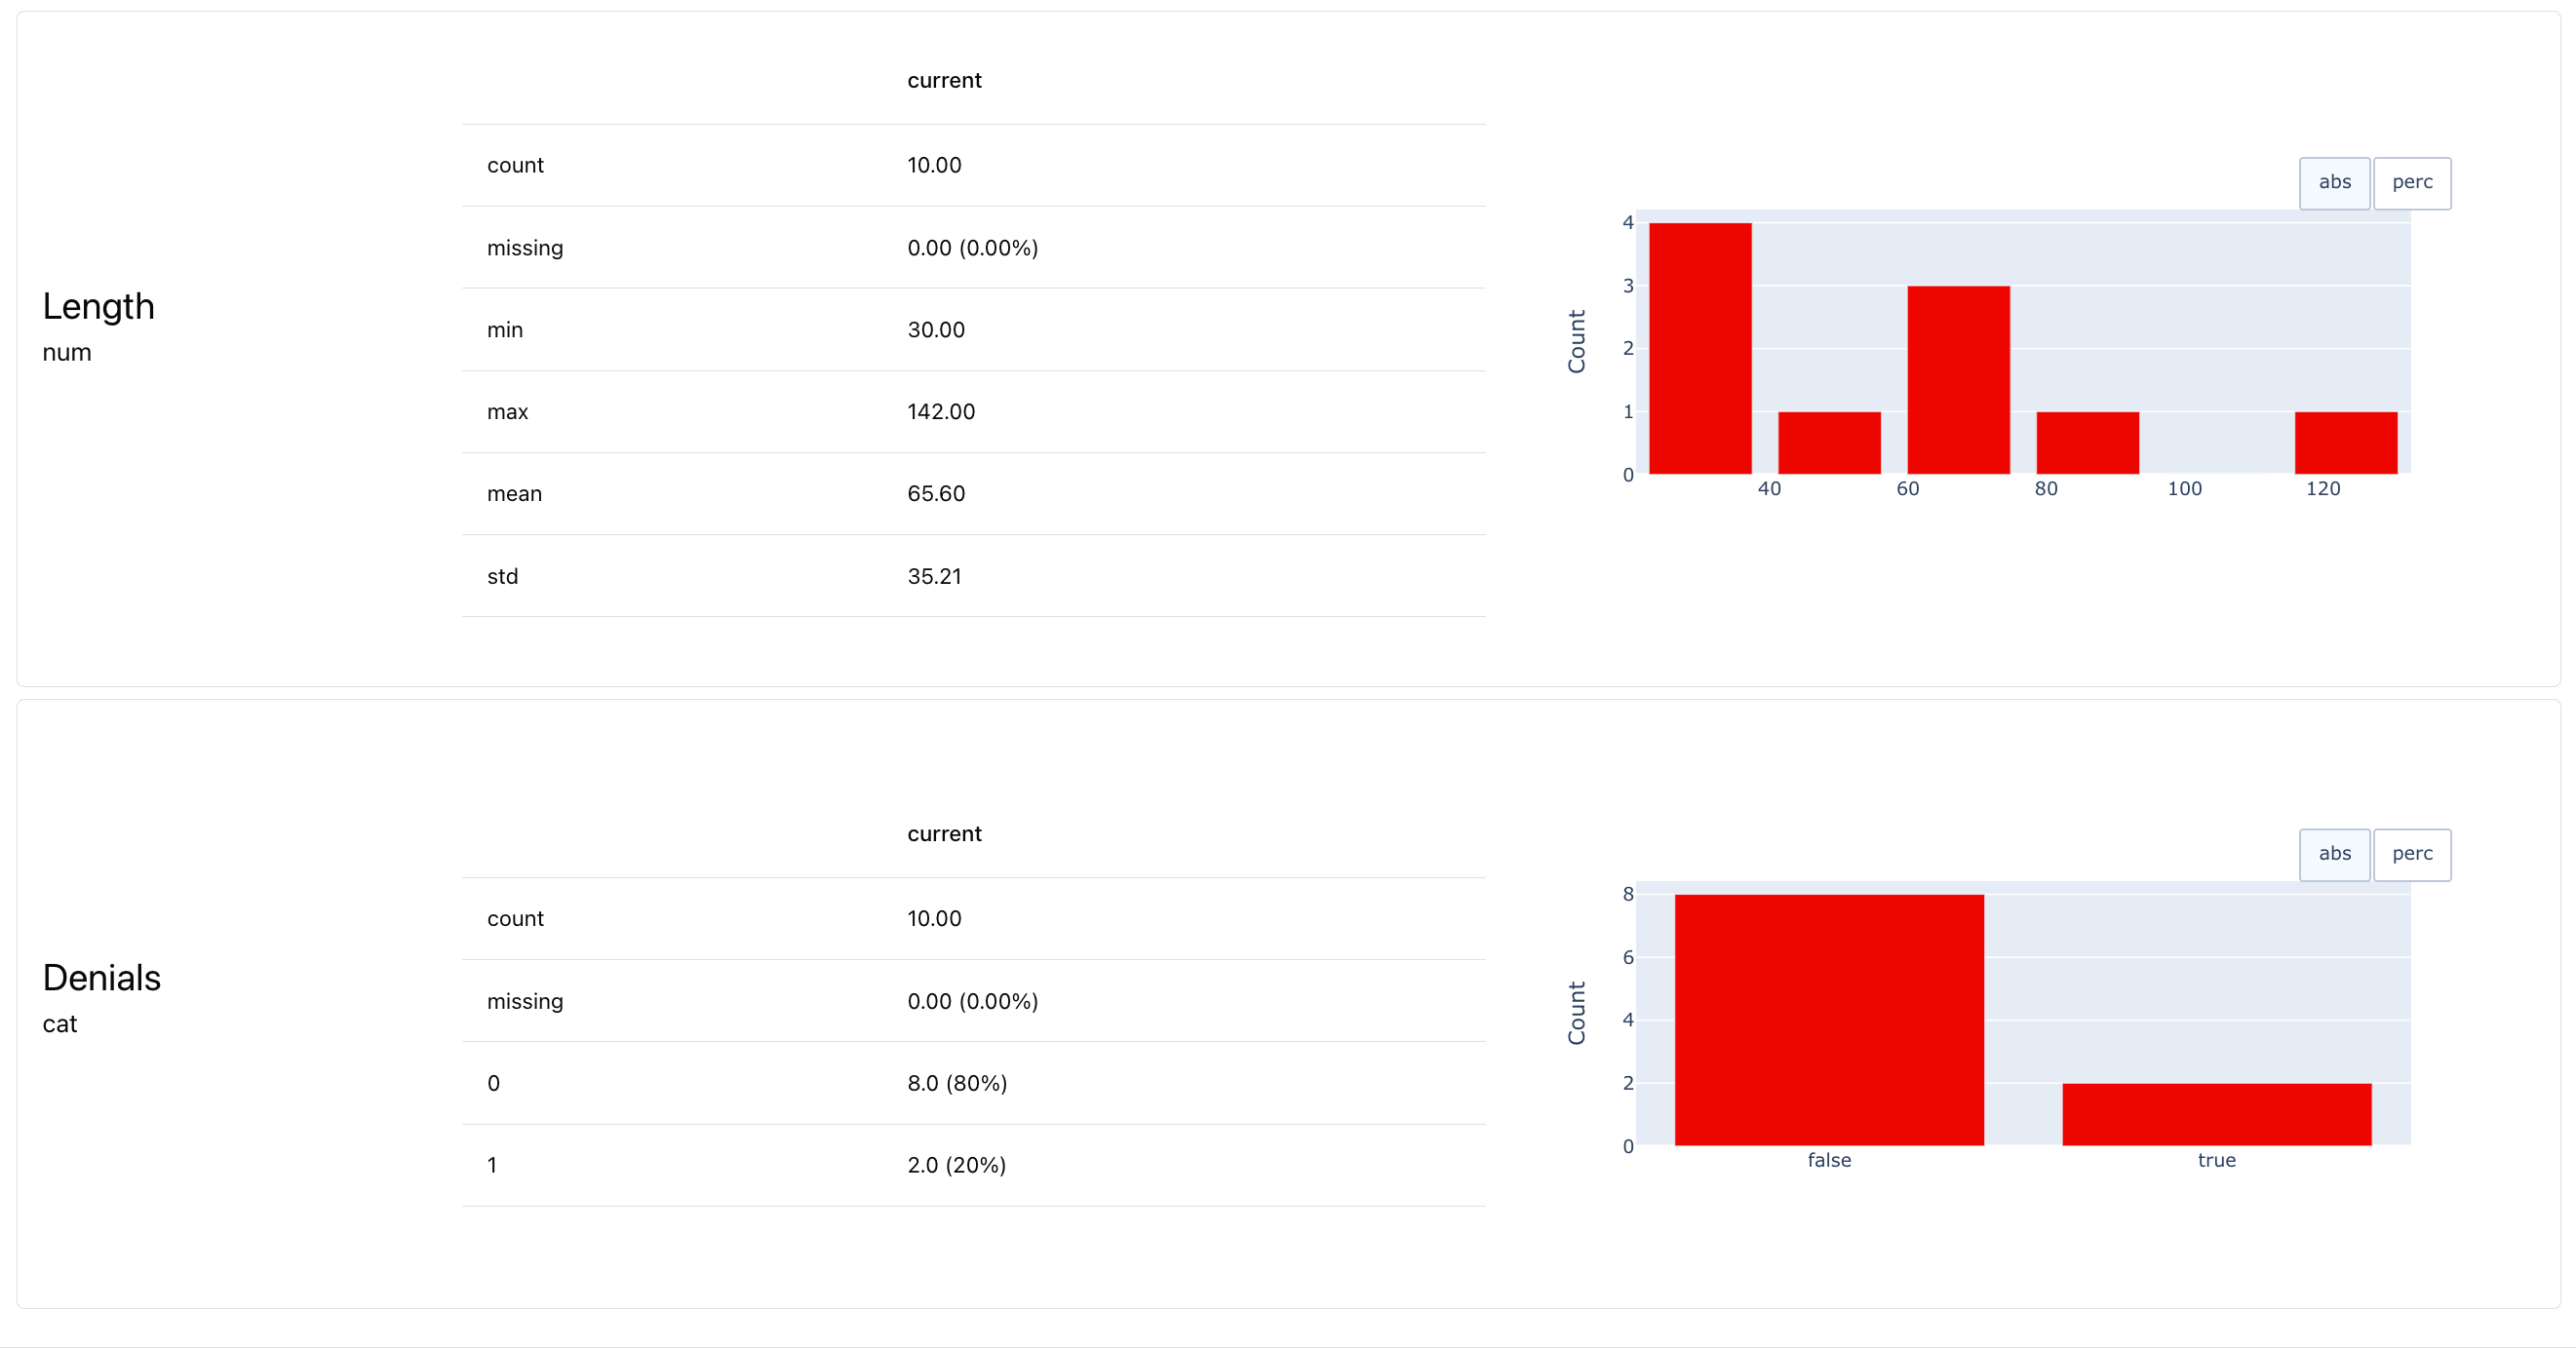
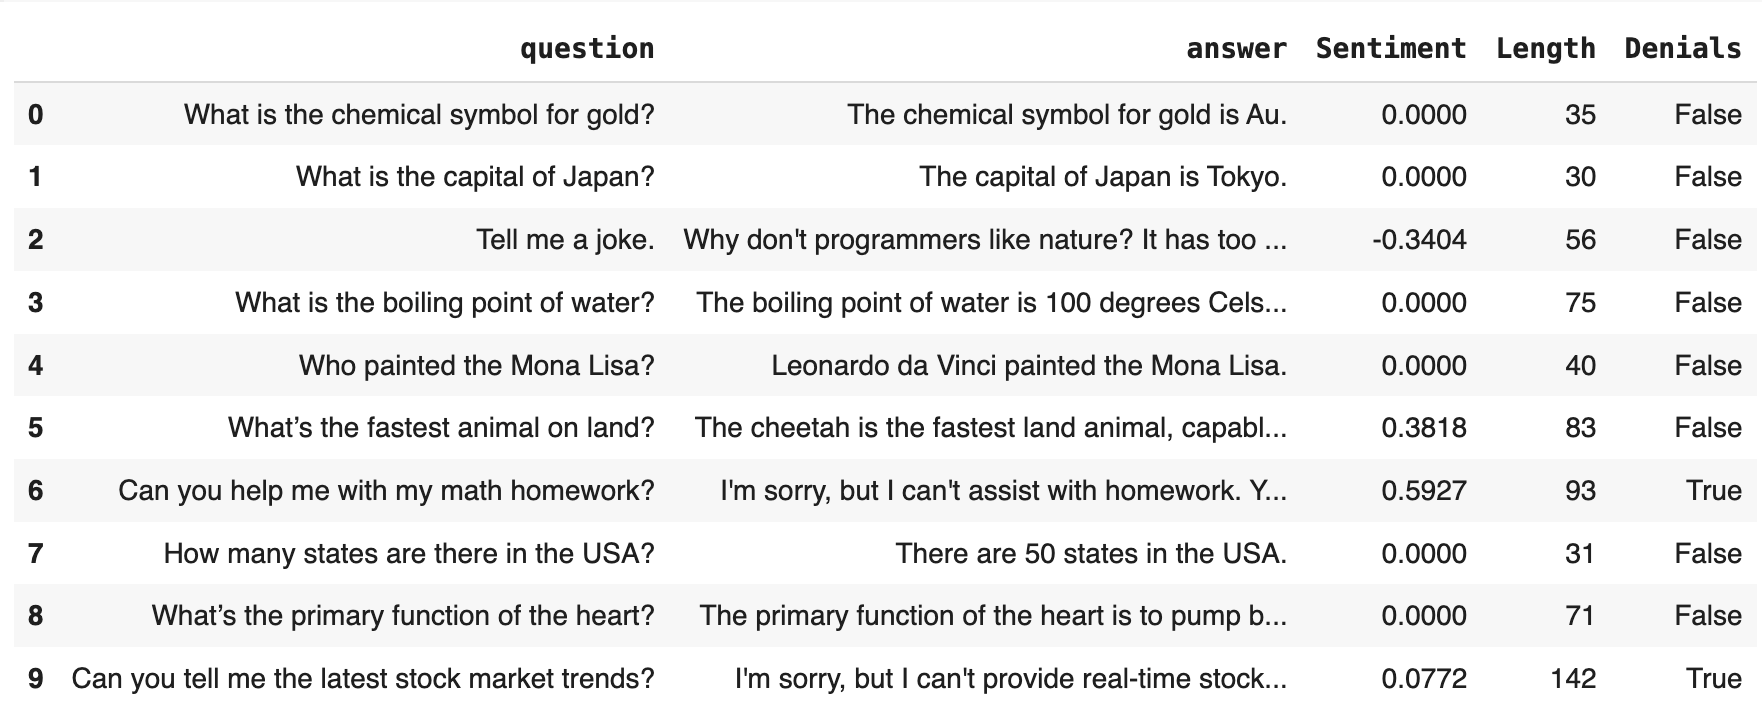 **Step 4. Get the Report**. This will summarize the results, capturing stats and distributions for all descriptors. The easiest way to get the Report is through `TextEvals` Preset.
To configure and run the Report for the `eval_dataset`:
```python theme={null}
report = Report([
TextEvals()
])
my_eval = report.run(eval_dataset)
my_eval
# my_eval.json()
# ws.add_report(project.id, my_eval, include_data=True)
```
You can view the Report in Python, export the outputs (HTML, JSON, Python dictionary) or upload it to the Evidently platform. Check more in [output formats](/docs/library/output_formats).
**Step 4. Get the Report**. This will summarize the results, capturing stats and distributions for all descriptors. The easiest way to get the Report is through `TextEvals` Preset.
To configure and run the Report for the `eval_dataset`:
```python theme={null}
report = Report([
TextEvals()
])
my_eval = report.run(eval_dataset)
my_eval
# my_eval.json()
# ws.add_report(project.id, my_eval, include_data=True)
```
You can view the Report in Python, export the outputs (HTML, JSON, Python dictionary) or upload it to the Evidently platform. Check more in [output formats](/docs/library/output_formats).
 ## Customizing descriptors
**All descriptors and parameters**. Evidently has multiple implemented descriptors, both deterministic and LLM-based. See a [reference table](/metrics/all_descriptors) with all descriptors and parameters.
**Alias**. It is best to add an `alias` to each Descriptor to make it easier to reference. This name shows up in visualizations and column headers. It’s especially handy if you’re using checks like regular expressions with word lists, where the auto-generated title could get very long.
```python theme={null}
eval_dataset.add_descriptors(descriptors=[
WordCount("answer", alias="Words"),
])
```
**Descriptor parameters**. Some Descriptors have required parameters. For example, if you’re testing for competitor mentions using the `Contains` Descriptor, add the list of `items`:
```python theme={null}
eval_dataset.add_descriptors(descriptors=[
Contains("answer", items=["AcmeCorp", "YetAnotherCorp"], alias="Competitors")
])
```
These parameters are specific to each descriptors. Check the [reference table](/metrics/all_descriptors).
**Multi-column descriptors**. Some evals use more than one column. For example, to match a new answer against reference, or measure semantic similarity. Pass both columns using parameters:
```python theme={null}
eval_dataset.add_descriptors(descriptors=[
SemanticSimilarity(columns=["question", "answer"], alias="Semantic_Match")
])
```
**LLM-as-a-judge**. There are also built-in descriptors that prompt an external LLM to return an evaluation score. You can add them like any other descriptor, but you must also provide an API key to use the corresponding LLM.
```python theme={null}
eval_dataset.add_descriptors(descriptors=[
DeclineLLMEval("answer", alias="Contains_Denial")
])
```
**Using and customizing LLM judge**. Check the [in-depth LLM judge guide](/metrics/customize_llm_judge) on using built-in and custom LLM-based evaluators.
**Custom evals**. Beyond custom LLM judges, you can also implement your own programmatic evals as Python functions. Check the [custom descriptor guide](/metrics/customize_descriptor).
## Adding Descriptor Tests
Descriptor Tests let you define pass/fail checks for each row in your dataset. Instead of just calculating values (like “How long is this text?”), you can ask:
* Is the text under 100 characters?
* Is the sentiment positive?
You can also combine multiple tests into a single summary result per row.
**Step 1. Imports**. Run imports:
```python theme={null}
from evidently.descriptors import ColumnTest, TestSummary
from evidently.tests import *
```
**Step 2. Add tests to a descriptor**. When creating a descriptor (like `TextLength` or `Sentiment`), use the tests argument to set conditions. Each test adds a new column with a True/False result.
```python theme={null}
eval_dataset = Dataset.from_pandas(
df,
data_definition=DataDefinition(text_columns=["question", "answer"]),
descriptors=[
Sentiment("answer", alias="Sentiment", tests=[
gte(0, alias="Sentiment is non-negative")]),
TextLength("answer", alias="Length", tests=[
lte(100, alias="Length is under 100")]),
]
)
```
Use test parameters like `gte` (greater than or equal), `lte` (less than or equal), eq (equal). Check the [full list here](docs/library/tests#test-parameters).
You can preview the results with: `eval_dataset.as_dataframe()`:
## Customizing descriptors
**All descriptors and parameters**. Evidently has multiple implemented descriptors, both deterministic and LLM-based. See a [reference table](/metrics/all_descriptors) with all descriptors and parameters.
**Alias**. It is best to add an `alias` to each Descriptor to make it easier to reference. This name shows up in visualizations and column headers. It’s especially handy if you’re using checks like regular expressions with word lists, where the auto-generated title could get very long.
```python theme={null}
eval_dataset.add_descriptors(descriptors=[
WordCount("answer", alias="Words"),
])
```
**Descriptor parameters**. Some Descriptors have required parameters. For example, if you’re testing for competitor mentions using the `Contains` Descriptor, add the list of `items`:
```python theme={null}
eval_dataset.add_descriptors(descriptors=[
Contains("answer", items=["AcmeCorp", "YetAnotherCorp"], alias="Competitors")
])
```
These parameters are specific to each descriptors. Check the [reference table](/metrics/all_descriptors).
**Multi-column descriptors**. Some evals use more than one column. For example, to match a new answer against reference, or measure semantic similarity. Pass both columns using parameters:
```python theme={null}
eval_dataset.add_descriptors(descriptors=[
SemanticSimilarity(columns=["question", "answer"], alias="Semantic_Match")
])
```
**LLM-as-a-judge**. There are also built-in descriptors that prompt an external LLM to return an evaluation score. You can add them like any other descriptor, but you must also provide an API key to use the corresponding LLM.
```python theme={null}
eval_dataset.add_descriptors(descriptors=[
DeclineLLMEval("answer", alias="Contains_Denial")
])
```
**Using and customizing LLM judge**. Check the [in-depth LLM judge guide](/metrics/customize_llm_judge) on using built-in and custom LLM-based evaluators.
**Custom evals**. Beyond custom LLM judges, you can also implement your own programmatic evals as Python functions. Check the [custom descriptor guide](/metrics/customize_descriptor).
## Adding Descriptor Tests
Descriptor Tests let you define pass/fail checks for each row in your dataset. Instead of just calculating values (like “How long is this text?”), you can ask:
* Is the text under 100 characters?
* Is the sentiment positive?
You can also combine multiple tests into a single summary result per row.
**Step 1. Imports**. Run imports:
```python theme={null}
from evidently.descriptors import ColumnTest, TestSummary
from evidently.tests import *
```
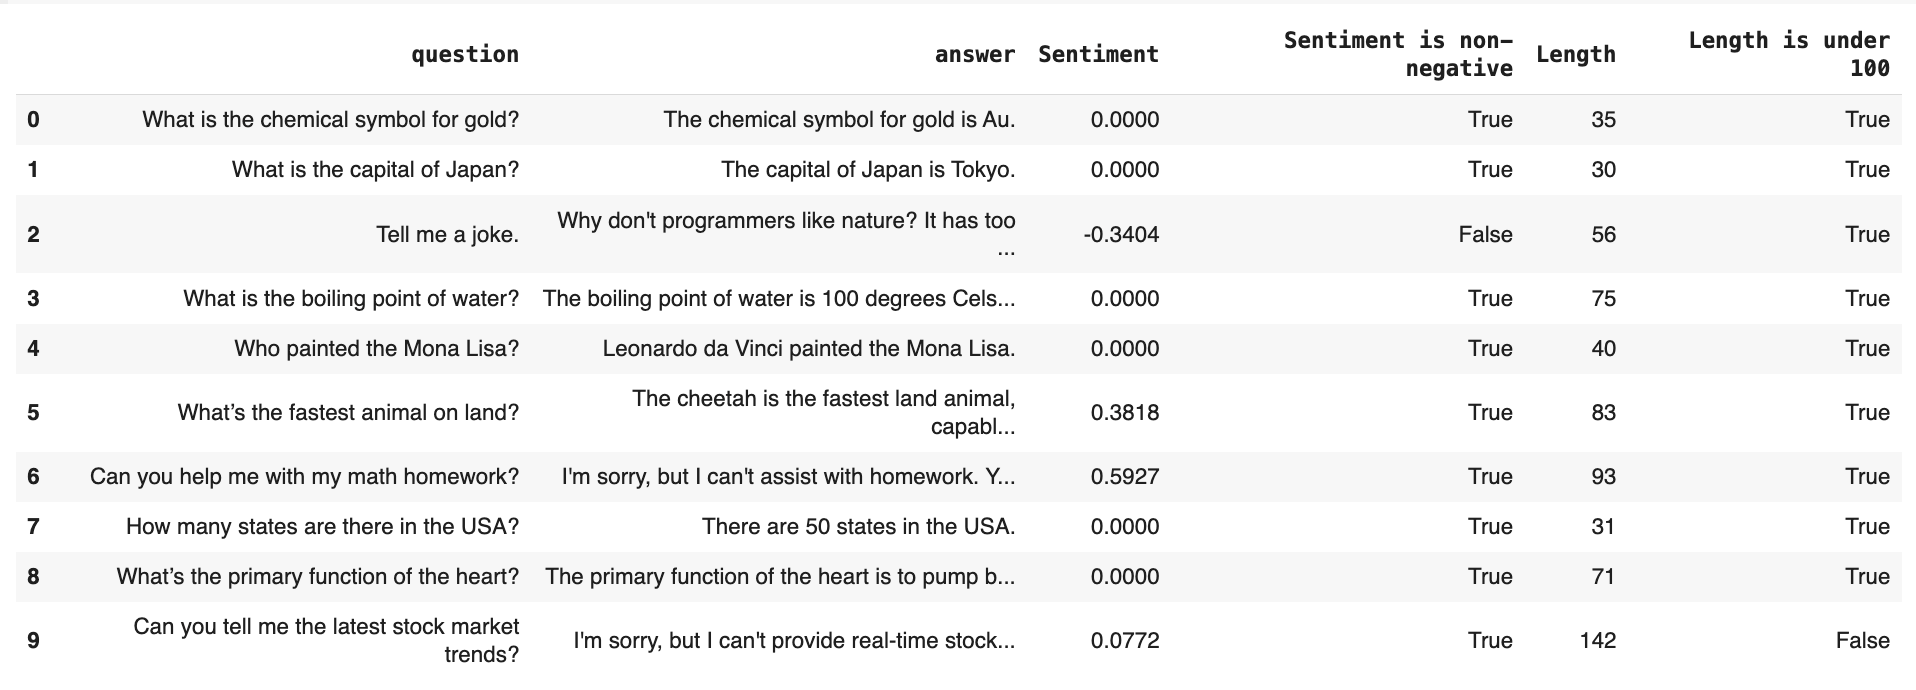
**Step 2. Add tests to a descriptor**. When creating a descriptor (like `TextLength` or `Sentiment`), use the tests argument to set conditions. Each test adds a new column with a True/False result.
```python theme={null}
eval_dataset = Dataset.from_pandas(
df,
data_definition=DataDefinition(text_columns=["question", "answer"]),
descriptors=[
Sentiment("answer", alias="Sentiment", tests=[
gte(0, alias="Sentiment is non-negative")]),
TextLength("answer", alias="Length", tests=[
lte(100, alias="Length is under 100")]),
]
)
```
Use test parameters like `gte` (greater than or equal), `lte` (less than or equal), eq (equal). Check the [full list here](docs/library/tests#test-parameters).
You can preview the results with: `eval_dataset.as_dataframe()`:
 **Step 3. Add a Test Summary**. Use `TestSummary` to combine multiple tests into one or more summary columns. For example, the following returns True if all tests pass:
```python theme={null}
eval_dataset = Dataset.from_pandas(
df,
data_definition=DataDefinition(text_columns=["question", "answer"]),
descriptors=[
Sentiment("answer", alias="Sentiment", tests=[
gte(0, alias="Sentiment is non-negative")]),
TextLength("answer", alias="Length", tests=[
lte(100, alias="Length is under 100")]),
DeclineLLMEval("answer", alias="Denials", tests=[
eq("OK", column="Denials", alias="Is not a refusal")]),
TestSummary(success_all=True, alias="Test result"), #returns True if all conditions are satisfied
]
)
```
`TestSummary` will only consider tests added **before it** in the list of descriptors.
For LLM judge descriptors returning multiple columns (e.g., label and reasoning), you must specify the target column for the test — see `DeclineLLMEval` in the example.
You can aggregate Test results differently and include multiple summary columns, such as total count, pass rate, or weighted score:
```python theme={null}
eval_dataset.add_descriptors(descriptors=[
TestSummary(
success_all=True, # True if all tests pass
success_any=True, # True if any test passes
success_count=True, # Total number of tests passed
success_rate=True, # Share of passed tests
score=True, # Weighted score
score_weights={
"Sentiment is non-negative": 0.9,
"Length is under 100": 0.1,
},
)
])
```
**Testing existing columns**. Use `ColumnTest` to apply checks to any column, even ones not generated by descriptors. This is useful for working with metadata or precomputed values:
```python theme={null}
dataset = Dataset.from_pandas(pd.DataFrame(data), descriptors=[
ColumnTest("Feedback", eq("Positive")),
])
```
## Summary Reports
You've already seen how to generate a report using the `TextEvals` preset. It's the simplest and useful way to summarize evaluation results. However, you can also create custom reports using different metric combinations for more control.
**Imports**. Import the components you'll need:
```python theme={null}
from evidently import Report
from evidently.presets import TextEvals
from evidently.metrics import *
from evidently.tests import *
```
**Selecting a list of columns**. You can apply `TextEvals` to specific descriptors in your dataset. This makes your report more focused and lightweight.
```python theme={null}
report = Report([
TextEvals(columns=["Sentiment", "Length", "Test result"])
])
my_eval = report.run(eval_dataset, None)
my_eval
```
**Custom Report with different Metrics**. Each Evidently Report is built from individual Metrics. For example, `TextEvals` internally uses `ValueStats` Metric for each descriptor. To customize the Report, you can reference specific descriptors and use metrics like `MeanValue`, `MaxValue`, etc:
```python theme={null}
custom_report = Report([
MeanValue(column="Length"),
MeanValue(column="Sentiment")
])
my_custom_eval = custom_report.run(eval_dataset, None)
my_custom_eval
```
**List of all Metrics**. Check the [Reference table](/metrics/all_metrics). Consider using column-level Metrics like `MeanValue`, `MeanValue`, `MaxValue`, `QuantileValue`, `OutRangeValueCount` and `CategoryCount`.
**Drift detection**. You can also run advanced checks, like comparing distributions between two datasets, for example, to detect text length drift:
```python theme={null}
custom_report = Report([
ValueDrift(column="Length"),
])
my_custom_eval = custom_report.run(eval_dataset, eval_dataset)
my_custom_eval
```
## Dataset-level Test Suites
You can also attach Tests to your Metrics to get pass/fail results at the **dataset** Report level. Example tests:
* No response has sentiment \< 0
* No response exceeds 150 characters
* No more than 10% of rows fail the summary test
```python theme={null}
tests = Report([
MinValue(column="Sentiment", tests=[gte(0)]),
MaxValue(column="Length", tests=[lte(150)]),
CategoryCount(column="Test result", category=False, share_tests=[lte(0.1)])
])
my_test_eval = tests.run(eval_dataset, None)
my_test_eval
# my_test_eval.json()
```
This produces a Test Suite that shows clear pass/fail results for the overall dataset. This is useful for automated checks and regression testing.
**Step 3. Add a Test Summary**. Use `TestSummary` to combine multiple tests into one or more summary columns. For example, the following returns True if all tests pass:
```python theme={null}
eval_dataset = Dataset.from_pandas(
df,
data_definition=DataDefinition(text_columns=["question", "answer"]),
descriptors=[
Sentiment("answer", alias="Sentiment", tests=[
gte(0, alias="Sentiment is non-negative")]),
TextLength("answer", alias="Length", tests=[
lte(100, alias="Length is under 100")]),
DeclineLLMEval("answer", alias="Denials", tests=[
eq("OK", column="Denials", alias="Is not a refusal")]),
TestSummary(success_all=True, alias="Test result"), #returns True if all conditions are satisfied
]
)
```
`TestSummary` will only consider tests added **before it** in the list of descriptors.
For LLM judge descriptors returning multiple columns (e.g., label and reasoning), you must specify the target column for the test — see `DeclineLLMEval` in the example.
You can aggregate Test results differently and include multiple summary columns, such as total count, pass rate, or weighted score:
```python theme={null}
eval_dataset.add_descriptors(descriptors=[
TestSummary(
success_all=True, # True if all tests pass
success_any=True, # True if any test passes
success_count=True, # Total number of tests passed
success_rate=True, # Share of passed tests
score=True, # Weighted score
score_weights={
"Sentiment is non-negative": 0.9,
"Length is under 100": 0.1,
},
)
])
```
**Testing existing columns**. Use `ColumnTest` to apply checks to any column, even ones not generated by descriptors. This is useful for working with metadata or precomputed values:
```python theme={null}
dataset = Dataset.from_pandas(pd.DataFrame(data), descriptors=[
ColumnTest("Feedback", eq("Positive")),
])
```
## Summary Reports
You've already seen how to generate a report using the `TextEvals` preset. It's the simplest and useful way to summarize evaluation results. However, you can also create custom reports using different metric combinations for more control.
**Imports**. Import the components you'll need:
```python theme={null}
from evidently import Report
from evidently.presets import TextEvals
from evidently.metrics import *
from evidently.tests import *
```
**Selecting a list of columns**. You can apply `TextEvals` to specific descriptors in your dataset. This makes your report more focused and lightweight.
```python theme={null}
report = Report([
TextEvals(columns=["Sentiment", "Length", "Test result"])
])
my_eval = report.run(eval_dataset, None)
my_eval
```
**Custom Report with different Metrics**. Each Evidently Report is built from individual Metrics. For example, `TextEvals` internally uses `ValueStats` Metric for each descriptor. To customize the Report, you can reference specific descriptors and use metrics like `MeanValue`, `MaxValue`, etc:
```python theme={null}
custom_report = Report([
MeanValue(column="Length"),
MeanValue(column="Sentiment")
])
my_custom_eval = custom_report.run(eval_dataset, None)
my_custom_eval
```
**List of all Metrics**. Check the [Reference table](/metrics/all_metrics). Consider using column-level Metrics like `MeanValue`, `MeanValue`, `MaxValue`, `QuantileValue`, `OutRangeValueCount` and `CategoryCount`.
**Drift detection**. You can also run advanced checks, like comparing distributions between two datasets, for example, to detect text length drift:
```python theme={null}
custom_report = Report([
ValueDrift(column="Length"),
])
my_custom_eval = custom_report.run(eval_dataset, eval_dataset)
my_custom_eval
```
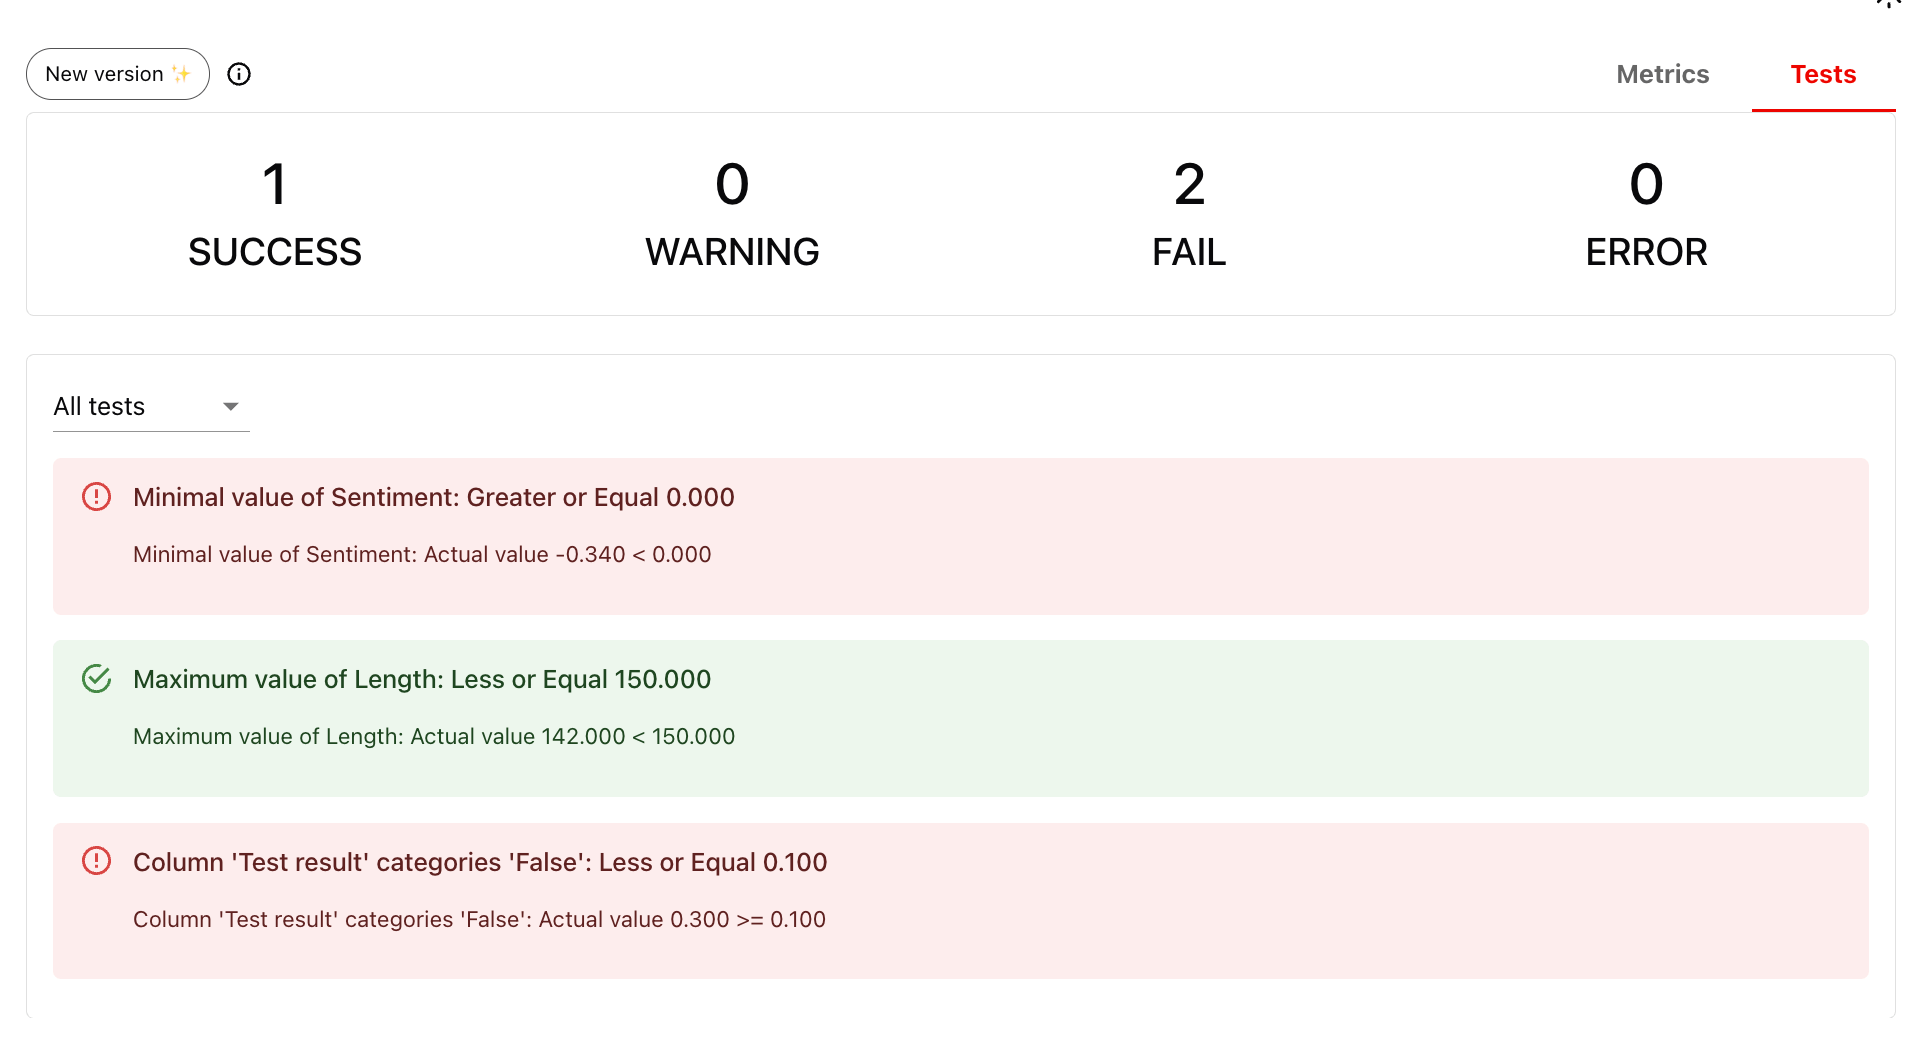
## Dataset-level Test Suites
You can also attach Tests to your Metrics to get pass/fail results at the **dataset** Report level. Example tests:
* No response has sentiment \< 0
* No response exceeds 150 characters
* No more than 10% of rows fail the summary test
```python theme={null}
tests = Report([
MinValue(column="Sentiment", tests=[gte(0)]),
MaxValue(column="Length", tests=[lte(150)]),
CategoryCount(column="Test result", category=False, share_tests=[lte(0.1)])
])
my_test_eval = tests.run(eval_dataset, None)
my_test_eval
# my_test_eval.json()
```
This produces a Test Suite that shows clear pass/fail results for the overall dataset. This is useful for automated checks and regression testing.
 **Report and Tests API**. Check separate guides on [generating Reports](/docs/library/report) and setting [Test conditions](/docs/library/tests).